Simulation results from the supplement I (small-scale simulation)
Pedro L. Baldoni
12 October, 2024
Last updated: 2024-10-12
Checks: 7 0
Knit directory: GibbsDTE-code/analysis/
This reproducible R Markdown analysis was created with workflowr (version 1.7.1). The Checks tab describes the reproducibility checks that were applied when the results were created. The Past versions tab lists the development history.
Great! Since the R Markdown file has been committed to the Git repository, you know the exact version of the code that produced these results.
Great job! The global environment was empty. Objects defined in the global environment can affect the analysis in your R Markdown file in unknown ways. For reproduciblity it’s best to always run the code in an empty environment.
The command set.seed(20231211) was run prior to running
the code in the R Markdown file. Setting a seed ensures that any results
that rely on randomness, e.g. subsampling or permutations, are
reproducible.
Great job! Recording the operating system, R version, and package versions is critical for reproducibility.
Nice! There were no cached chunks for this analysis, so you can be confident that you successfully produced the results during this run.
Great job! Using relative paths to the files within your workflowr project makes it easier to run your code on other machines.
Great! You are using Git for version control. Tracking code development and connecting the code version to the results is critical for reproducibility.
The results in this page were generated with repository version d1585c4. See the Past versions tab to see a history of the changes made to the R Markdown and HTML files.
Note that you need to be careful to ensure that all relevant files for
the analysis have been committed to Git prior to generating the results
(you can use wflow_publish or
wflow_git_commit). workflowr only checks the R Markdown
file, but you know if there are other scripts or data files that it
depends on. Below is the status of the Git repository when the results
were generated:
Ignored files:
    Ignored:    .Rhistory
    Ignored:    .Rprofile
    Ignored:    .Rproj.user/
    Ignored:    .gitattributes
    Ignored:    .gitignore
    Ignored:    GibbsDTE-code.Rproj
    Ignored:    code/lung/data/slurm-10678225.out
    Ignored:    code/lung/index-subread/.RData
    Ignored:    code/lung/index-subread/buildindex.Rout
    Ignored:    code/lung/index-subread/slurm-15397947.out
    Ignored:    code/lung/index-subread/slurm-15397948.out
    Ignored:    code/lung/index-subread/slurm-15397949.out
    Ignored:    code/lung/index/slurm-10679764.out
    Ignored:    code/lung/index/slurm-10679768.out
    Ignored:    code/lung/index/slurm-10684814.out
    Ignored:    code/lung/kallisto/slurm-16121443.out
    Ignored:    code/lung/salmon/.RData
    Ignored:    code/lung/salmon/runWasabi.Rout
    Ignored:    code/lung/salmon/slurm-15257704.out
    Ignored:    code/lung/salmon/slurm-15397973.out
    Ignored:    code/lung/salmon/slurm-15887027.out
    Ignored:    code/lung/subread/.nextflow.log
    Ignored:    code/lung/subread/.nextflow/
    Ignored:    code/lung/subread/log/
    Ignored:    code/lung/subread/report.html
    Ignored:    code/lung/subread/slurm-15398003.out
    Ignored:    code/lung/subread/timeline.html
    Ignored:    code/lung/subread/trace-20240201-45121600.txt
    Ignored:    code/pkg/.Rbuildignore
    Ignored:    code/pkg/.Rhistory
    Ignored:    code/pkg/.Rproj.user/
    Ignored:    code/pkg/pkg.Rproj
    Ignored:    code/pkg/src/.gitignore
    Ignored:    code/pkg/src/RcppExports.o
    Ignored:    code/pkg/src/pkg.so
    Ignored:    code/pkg/src/rcpparma_hello_world.o
    Ignored:    code/simulation-large/parameters.txt
    Ignored:    code/simulation-large/slurm-18426741_1.out
    Ignored:    code/simulation-large/slurm-18426741_10.out
    Ignored:    code/simulation-large/slurm-18426741_11.out
    Ignored:    code/simulation-large/slurm-18426741_12.out
    Ignored:    code/simulation-large/slurm-18426741_13.out
    Ignored:    code/simulation-large/slurm-18426741_14.out
    Ignored:    code/simulation-large/slurm-18426741_15.out
    Ignored:    code/simulation-large/slurm-18426741_16.out
    Ignored:    code/simulation-large/slurm-18426741_17.out
    Ignored:    code/simulation-large/slurm-18426741_18.out
    Ignored:    code/simulation-large/slurm-18426741_19.out
    Ignored:    code/simulation-large/slurm-18426741_2.out
    Ignored:    code/simulation-large/slurm-18426741_20.out
    Ignored:    code/simulation-large/slurm-18426741_3.out
    Ignored:    code/simulation-large/slurm-18426741_4.out
    Ignored:    code/simulation-large/slurm-18426741_5.out
    Ignored:    code/simulation-large/slurm-18426741_6.out
    Ignored:    code/simulation-large/slurm-18426741_7.out
    Ignored:    code/simulation-large/slurm-18426741_8.out
    Ignored:    code/simulation-large/slurm-18426741_9.out
    Ignored:    code/simulation-large/slurm-18432660.out
    Ignored:    code/simulation-large/slurm-18432662.out
    Ignored:    code/simulation-large/summarize.Rout
    Ignored:    code/simulation/.RData
    Ignored:    code/simulation/slurm-15466798.out
    Ignored:    code/simulation/slurm-15466799_1.out
    Ignored:    code/simulation/slurm-15466799_10.out
    Ignored:    code/simulation/slurm-15466799_100.out
    Ignored:    code/simulation/slurm-15466799_101.out
    Ignored:    code/simulation/slurm-15466799_102.out
    Ignored:    code/simulation/slurm-15466799_103.out
    Ignored:    code/simulation/slurm-15466799_104.out
    Ignored:    code/simulation/slurm-15466799_105.out
    Ignored:    code/simulation/slurm-15466799_106.out
    Ignored:    code/simulation/slurm-15466799_107.out
    Ignored:    code/simulation/slurm-15466799_108.out
    Ignored:    code/simulation/slurm-15466799_109.out
    Ignored:    code/simulation/slurm-15466799_11.out
    Ignored:    code/simulation/slurm-15466799_110.out
    Ignored:    code/simulation/slurm-15466799_111.out
    Ignored:    code/simulation/slurm-15466799_112.out
    Ignored:    code/simulation/slurm-15466799_113.out
    Ignored:    code/simulation/slurm-15466799_114.out
    Ignored:    code/simulation/slurm-15466799_115.out
    Ignored:    code/simulation/slurm-15466799_116.out
    Ignored:    code/simulation/slurm-15466799_117.out
    Ignored:    code/simulation/slurm-15466799_118.out
    Ignored:    code/simulation/slurm-15466799_119.out
    Ignored:    code/simulation/slurm-15466799_12.out
    Ignored:    code/simulation/slurm-15466799_120.out
    Ignored:    code/simulation/slurm-15466799_121.out
    Ignored:    code/simulation/slurm-15466799_122.out
    Ignored:    code/simulation/slurm-15466799_123.out
    Ignored:    code/simulation/slurm-15466799_124.out
    Ignored:    code/simulation/slurm-15466799_125.out
    Ignored:    code/simulation/slurm-15466799_126.out
    Ignored:    code/simulation/slurm-15466799_127.out
    Ignored:    code/simulation/slurm-15466799_128.out
    Ignored:    code/simulation/slurm-15466799_129.out
    Ignored:    code/simulation/slurm-15466799_13.out
    Ignored:    code/simulation/slurm-15466799_130.out
    Ignored:    code/simulation/slurm-15466799_131.out
    Ignored:    code/simulation/slurm-15466799_132.out
    Ignored:    code/simulation/slurm-15466799_133.out
    Ignored:    code/simulation/slurm-15466799_134.out
    Ignored:    code/simulation/slurm-15466799_135.out
    Ignored:    code/simulation/slurm-15466799_136.out
    Ignored:    code/simulation/slurm-15466799_137.out
    Ignored:    code/simulation/slurm-15466799_138.out
    Ignored:    code/simulation/slurm-15466799_139.out
    Ignored:    code/simulation/slurm-15466799_14.out
    Ignored:    code/simulation/slurm-15466799_140.out
    Ignored:    code/simulation/slurm-15466799_141.out
    Ignored:    code/simulation/slurm-15466799_142.out
    Ignored:    code/simulation/slurm-15466799_143.out
    Ignored:    code/simulation/slurm-15466799_144.out
    Ignored:    code/simulation/slurm-15466799_145.out
    Ignored:    code/simulation/slurm-15466799_146.out
    Ignored:    code/simulation/slurm-15466799_147.out
    Ignored:    code/simulation/slurm-15466799_148.out
    Ignored:    code/simulation/slurm-15466799_149.out
    Ignored:    code/simulation/slurm-15466799_15.out
    Ignored:    code/simulation/slurm-15466799_150.out
    Ignored:    code/simulation/slurm-15466799_151.out
    Ignored:    code/simulation/slurm-15466799_152.out
    Ignored:    code/simulation/slurm-15466799_153.out
    Ignored:    code/simulation/slurm-15466799_154.out
    Ignored:    code/simulation/slurm-15466799_155.out
    Ignored:    code/simulation/slurm-15466799_156.out
    Ignored:    code/simulation/slurm-15466799_157.out
    Ignored:    code/simulation/slurm-15466799_158.out
    Ignored:    code/simulation/slurm-15466799_159.out
    Ignored:    code/simulation/slurm-15466799_16.out
    Ignored:    code/simulation/slurm-15466799_160.out
    Ignored:    code/simulation/slurm-15466799_161.out
    Ignored:    code/simulation/slurm-15466799_162.out
    Ignored:    code/simulation/slurm-15466799_163.out
    Ignored:    code/simulation/slurm-15466799_164.out
    Ignored:    code/simulation/slurm-15466799_165.out
    Ignored:    code/simulation/slurm-15466799_166.out
    Ignored:    code/simulation/slurm-15466799_167.out
    Ignored:    code/simulation/slurm-15466799_168.out
    Ignored:    code/simulation/slurm-15466799_169.out
    Ignored:    code/simulation/slurm-15466799_17.out
    Ignored:    code/simulation/slurm-15466799_170.out
    Ignored:    code/simulation/slurm-15466799_171.out
    Ignored:    code/simulation/slurm-15466799_172.out
    Ignored:    code/simulation/slurm-15466799_173.out
    Ignored:    code/simulation/slurm-15466799_174.out
    Ignored:    code/simulation/slurm-15466799_175.out
    Ignored:    code/simulation/slurm-15466799_176.out
    Ignored:    code/simulation/slurm-15466799_177.out
    Ignored:    code/simulation/slurm-15466799_178.out
    Ignored:    code/simulation/slurm-15466799_179.out
    Ignored:    code/simulation/slurm-15466799_18.out
    Ignored:    code/simulation/slurm-15466799_180.out
    Ignored:    code/simulation/slurm-15466799_181.out
    Ignored:    code/simulation/slurm-15466799_182.out
    Ignored:    code/simulation/slurm-15466799_183.out
    Ignored:    code/simulation/slurm-15466799_184.out
    Ignored:    code/simulation/slurm-15466799_185.out
    Ignored:    code/simulation/slurm-15466799_186.out
    Ignored:    code/simulation/slurm-15466799_187.out
    Ignored:    code/simulation/slurm-15466799_188.out
    Ignored:    code/simulation/slurm-15466799_189.out
    Ignored:    code/simulation/slurm-15466799_19.out
    Ignored:    code/simulation/slurm-15466799_190.out
    Ignored:    code/simulation/slurm-15466799_191.out
    Ignored:    code/simulation/slurm-15466799_192.out
    Ignored:    code/simulation/slurm-15466799_193.out
    Ignored:    code/simulation/slurm-15466799_194.out
    Ignored:    code/simulation/slurm-15466799_195.out
    Ignored:    code/simulation/slurm-15466799_196.out
    Ignored:    code/simulation/slurm-15466799_197.out
    Ignored:    code/simulation/slurm-15466799_198.out
    Ignored:    code/simulation/slurm-15466799_199.out
    Ignored:    code/simulation/slurm-15466799_2.out
    Ignored:    code/simulation/slurm-15466799_20.out
    Ignored:    code/simulation/slurm-15466799_200.out
    Ignored:    code/simulation/slurm-15466799_21.out
    Ignored:    code/simulation/slurm-15466799_22.out
    Ignored:    code/simulation/slurm-15466799_23.out
    Ignored:    code/simulation/slurm-15466799_24.out
    Ignored:    code/simulation/slurm-15466799_25.out
    Ignored:    code/simulation/slurm-15466799_26.out
    Ignored:    code/simulation/slurm-15466799_27.out
    Ignored:    code/simulation/slurm-15466799_28.out
    Ignored:    code/simulation/slurm-15466799_29.out
    Ignored:    code/simulation/slurm-15466799_3.out
    Ignored:    code/simulation/slurm-15466799_30.out
    Ignored:    code/simulation/slurm-15466799_31.out
    Ignored:    code/simulation/slurm-15466799_32.out
    Ignored:    code/simulation/slurm-15466799_33.out
    Ignored:    code/simulation/slurm-15466799_34.out
    Ignored:    code/simulation/slurm-15466799_35.out
    Ignored:    code/simulation/slurm-15466799_36.out
    Ignored:    code/simulation/slurm-15466799_37.out
    Ignored:    code/simulation/slurm-15466799_38.out
    Ignored:    code/simulation/slurm-15466799_39.out
    Ignored:    code/simulation/slurm-15466799_4.out
    Ignored:    code/simulation/slurm-15466799_40.out
    Ignored:    code/simulation/slurm-15466799_41.out
    Ignored:    code/simulation/slurm-15466799_42.out
    Ignored:    code/simulation/slurm-15466799_43.out
    Ignored:    code/simulation/slurm-15466799_44.out
    Ignored:    code/simulation/slurm-15466799_45.out
    Ignored:    code/simulation/slurm-15466799_46.out
    Ignored:    code/simulation/slurm-15466799_47.out
    Ignored:    code/simulation/slurm-15466799_48.out
    Ignored:    code/simulation/slurm-15466799_49.out
    Ignored:    code/simulation/slurm-15466799_5.out
    Ignored:    code/simulation/slurm-15466799_50.out
    Ignored:    code/simulation/slurm-15466799_51.out
    Ignored:    code/simulation/slurm-15466799_52.out
    Ignored:    code/simulation/slurm-15466799_53.out
    Ignored:    code/simulation/slurm-15466799_54.out
    Ignored:    code/simulation/slurm-15466799_55.out
    Ignored:    code/simulation/slurm-15466799_56.out
    Ignored:    code/simulation/slurm-15466799_57.out
    Ignored:    code/simulation/slurm-15466799_58.out
    Ignored:    code/simulation/slurm-15466799_59.out
    Ignored:    code/simulation/slurm-15466799_6.out
    Ignored:    code/simulation/slurm-15466799_60.out
    Ignored:    code/simulation/slurm-15466799_61.out
    Ignored:    code/simulation/slurm-15466799_62.out
    Ignored:    code/simulation/slurm-15466799_63.out
    Ignored:    code/simulation/slurm-15466799_64.out
    Ignored:    code/simulation/slurm-15466799_65.out
    Ignored:    code/simulation/slurm-15466799_66.out
    Ignored:    code/simulation/slurm-15466799_67.out
    Ignored:    code/simulation/slurm-15466799_68.out
    Ignored:    code/simulation/slurm-15466799_69.out
    Ignored:    code/simulation/slurm-15466799_7.out
    Ignored:    code/simulation/slurm-15466799_70.out
    Ignored:    code/simulation/slurm-15466799_71.out
    Ignored:    code/simulation/slurm-15466799_72.out
    Ignored:    code/simulation/slurm-15466799_73.out
    Ignored:    code/simulation/slurm-15466799_74.out
    Ignored:    code/simulation/slurm-15466799_75.out
    Ignored:    code/simulation/slurm-15466799_76.out
    Ignored:    code/simulation/slurm-15466799_77.out
    Ignored:    code/simulation/slurm-15466799_78.out
    Ignored:    code/simulation/slurm-15466799_79.out
    Ignored:    code/simulation/slurm-15466799_8.out
    Ignored:    code/simulation/slurm-15466799_80.out
    Ignored:    code/simulation/slurm-15466799_81.out
    Ignored:    code/simulation/slurm-15466799_82.out
    Ignored:    code/simulation/slurm-15466799_83.out
    Ignored:    code/simulation/slurm-15466799_84.out
    Ignored:    code/simulation/slurm-15466799_85.out
    Ignored:    code/simulation/slurm-15466799_86.out
    Ignored:    code/simulation/slurm-15466799_87.out
    Ignored:    code/simulation/slurm-15466799_88.out
    Ignored:    code/simulation/slurm-15466799_89.out
    Ignored:    code/simulation/slurm-15466799_9.out
    Ignored:    code/simulation/slurm-15466799_90.out
    Ignored:    code/simulation/slurm-15466799_91.out
    Ignored:    code/simulation/slurm-15466799_92.out
    Ignored:    code/simulation/slurm-15466799_93.out
    Ignored:    code/simulation/slurm-15466799_94.out
    Ignored:    code/simulation/slurm-15466799_95.out
    Ignored:    code/simulation/slurm-15466799_96.out
    Ignored:    code/simulation/slurm-15466799_97.out
    Ignored:    code/simulation/slurm-15466799_98.out
    Ignored:    code/simulation/slurm-15466799_99.out
    Ignored:    code/simulation/slurm-15478249_201.out
    Ignored:    code/simulation/slurm-15478249_202.out
    Ignored:    code/simulation/slurm-15478249_203.out
    Ignored:    code/simulation/slurm-15478249_204.out
    Ignored:    code/simulation/slurm-15478249_205.out
    Ignored:    code/simulation/slurm-15478249_206.out
    Ignored:    code/simulation/slurm-15478249_207.out
    Ignored:    code/simulation/slurm-15478249_208.out
    Ignored:    code/simulation/slurm-15478249_209.out
    Ignored:    code/simulation/slurm-15478249_210.out
    Ignored:    code/simulation/slurm-15478249_211.out
    Ignored:    code/simulation/slurm-15478249_212.out
    Ignored:    code/simulation/slurm-15478249_213.out
    Ignored:    code/simulation/slurm-15478249_214.out
    Ignored:    code/simulation/slurm-15478249_215.out
    Ignored:    code/simulation/slurm-15478249_216.out
    Ignored:    code/simulation/slurm-15478249_217.out
    Ignored:    code/simulation/slurm-15478249_218.out
    Ignored:    code/simulation/slurm-15478249_219.out
    Ignored:    code/simulation/slurm-15478249_220.out
    Ignored:    code/simulation/slurm-15478249_221.out
    Ignored:    code/simulation/slurm-15478249_222.out
    Ignored:    code/simulation/slurm-15478249_223.out
    Ignored:    code/simulation/slurm-15478249_224.out
    Ignored:    code/simulation/slurm-15478249_225.out
    Ignored:    code/simulation/slurm-15478249_226.out
    Ignored:    code/simulation/slurm-15478249_227.out
    Ignored:    code/simulation/slurm-15478249_228.out
    Ignored:    code/simulation/slurm-15478249_229.out
    Ignored:    code/simulation/slurm-15478249_230.out
    Ignored:    code/simulation/slurm-15478249_231.out
    Ignored:    code/simulation/slurm-15478249_232.out
    Ignored:    code/simulation/slurm-15478249_233.out
    Ignored:    code/simulation/slurm-15478249_234.out
    Ignored:    code/simulation/slurm-15478249_235.out
    Ignored:    code/simulation/slurm-15478249_236.out
    Ignored:    code/simulation/slurm-15478249_237.out
    Ignored:    code/simulation/slurm-15478249_238.out
    Ignored:    code/simulation/slurm-15478249_239.out
    Ignored:    code/simulation/slurm-15478249_240.out
    Ignored:    code/simulation/slurm-15530400.out
    Ignored:    code/simulation/summarize.Rout
    Ignored:    data/annotation/hg38/gencode.v33.annotation.gtf.gz
    Ignored:    data/annotation/mm39/
    Ignored:    data/lung-ont/220928_dge.rds
    Ignored:    data/lung/fastq/
    Ignored:    data/lung/index-kallisto/
    Ignored:    data/lung/index-subread/
    Ignored:    data/lung/index/
    Ignored:    ignore/
    Ignored:    misc/
    Ignored:    output/lung/
    Ignored:    output/simulation-large/
    Ignored:    output/simulation/
    Ignored:    renv/
Note that any generated files, e.g. HTML, png, CSS, etc., are not included in this status report because it is ok for generated content to have uncommitted changes.
These are the previous versions of the repository in which changes were
made to the R Markdown (analysis/simulation-supp.Rmd) and
HTML (docs/simulation-supp.html) files. If you’ve
configured a remote Git repository (see ?wflow_git_remote),
click on the hyperlinks in the table below to view the files as they
were in that past version.
| File | Version | Author | Date | Message |
|---|---|---|---|---|
| Rmd | d1585c4 | Pedro Baldoni | 2024-10-12 | Updating Supp Figure S9 to the same format as in the main text |
| html | d7807a8 | Pedro Baldoni | 2024-10-09 | Build site. |
| Rmd | 529139f | Pedro Baldoni | 2024-10-09 | NARGAB Revision from October 2024 |
| html | 0f05c72 | Pedro Baldoni | 2024-06-24 | Build site. |
| Rmd | 5b41ed5 | Pedro Baldoni | 2024-06-24 | Printing out tables |
| html | 70ab63f | Pedro Baldoni | 2024-04-05 | Publishing workflowr |
| Rmd | bebf946 | Pedro Baldoni | 2024-04-05 | Adding simulation Rmds |
Introduction
This Rmarkdown generates Supplementary Figures S4–S9 and Supplementary Table S1 from our Gibbs DTE paper. The results are based on the simulation designed to emulate small-scale experiments with low biological variation and sample size, a typical scenario of RNA-seq studies with genetically modified organisms or cell lines.
Setup
Below we set options for this Rmarkdown report and load the necessary libraries.
knitr::opts_chunk$set(dev = "png",
                      dpi = 300,
                      dev.args = list(type = "cairo-png"),
                      root.dir = '.',
                      autodep = TRUE)

options(knitr.kable.NA = "-")

bs <- 8
library(data.table)
library(magrittr)
library(ggplot2)
library(patchwork)
library(plyr)
library(kableExtra)
devtools::load_all('../code/pkg')Next we set the paths to our simulation results.
path.misc <- file.path('../misc/simulation-supp.Rmd')
dir.create(path.misc,recursive = TRUE,showWarnings = FALSE)

path.example <- "../output/simulation/data/mm39/readlen-100/fc2/paired-end/9999TxPerGene/unbalanced/5libsPerGroup"

path.fdr <-
  list.files('../output/simulation/summary','fdr.tsv.gz',recursive = TRUE,full.names = TRUE)
path.metrics <-
  list.files('../output/simulation/summary','metrics.tsv.gz',recursive = TRUE,full.names = TRUE)
path.time <-
  list.files('../output/simulation/summary','^time.tsv.gz',recursive = TRUE,full.names = TRUE)
path.quanttime <-
  list.files('../output/simulation/summary','quanttime.tsv.gz',recursive = TRUE,full.names = TRUE)
path.quantile <-
  list.files('../output/simulation/summary','quantile.tsv.gz',recursive = TRUE,full.names = TRUE)
path.pvalue <-
  list.files('../output/simulation/summary','pvalue.tsv.gz',recursive = TRUE,full.names = TRUE)
path.overdispersion <-
  list.files('../output/simulation/summary','overdispersion.tsv.gz',recursive = TRUE,full.names = TRUE)
path.roc <-
  list.files('../output/simulation/summary','roc.tsv.gz',recursive = TRUE,full.names = TRUE)
Data loading
Below we load the actual results and relabel some of the factor variables.
relabel <- function(x){
  y <- copy(x)
  y$TxPerGene %<>% factor(levels = paste0(c(2, 3, 4, 5, 9999), 'TxPerGene'),labels = c(paste0("#Tx/Gene = ", c(2, 3, 4, 5)), 'All Transcripts')) %<>% droplevels()
  y$LibsPerGroup %<>% factor(levels = paste0(c(3, 5, 10), 'libsPerGroup'),labels = paste0('#Lib/Group = ', c(3, 5, 10))) %<>% droplevels()
  y$Quantifier %<>% factor(levels = c('salmon','salmon-gibbs','kallisto'),labels = c('Salmon-Boot','Salmon-Gibbs','kallisto')) %<>% droplevels()
  y$Length %<>% factor(levels = paste0('readlen-', seq(50, 150, 25)),labels = paste0(seq(50, 150, 25), 'bp')) %<>% droplevels()
  if (!is.null(x$Sample)) {
    y$Sample %<>% factor(levels = c(paste0("groupA_rep",1:10,"_R1"),paste0("groupB_rep",1:10,"_R1")),labels = c(paste0("A",1:10),paste0("B",1:10))) %<>% droplevels()
  }
  return(y)
}

# Loading datasets
dt.fdr <- do.call(rbind,lapply(path.fdr,fread)) %>% relabel()
dt.metrics <- do.call(rbind,lapply(path.metrics,fread)) %>% relabel()
dt.time <- do.call(rbind,lapply(path.time,fread)) %>% relabel()
dt.quanttime <- do.call(rbind,lapply(path.quanttime,fread)) %>% relabel()
dt.quantile <- do.call(rbind,lapply(path.quantile,fread)) %>% relabel()
dt.pvalue <- do.call(rbind,lapply(path.pvalue,fread)) %>% relabel()
dt.overdispersion <- do.call(rbind,lapply(path.overdispersion,fread)) %>% relabel()
dt.roc <- do.call(rbind,lapply(path.roc,fread)) %>% relabel()
Power
Below I compute the barplots of Supplementary Figures S4–S8.
dt.power <- dt.metrics[FC == 'fc2' &
                         !grepl("\\.n|RC",Method) &
                         Scenario == 'unbalanced',]

dt.power$LibsPerGroup %<>% factor(levels = paste0('#Lib/Group = ', c(3, 5,10)),labels = paste0(c(3,5,10),' samples per group'))
dt.power$Scenario %<>% factor(levels = c('balanced','unbalanced'),labels = c('Equal library sizes','Unequal library sizes'))
dt.power$Quantifier %<>%
  factor(levels = c('kallisto','Salmon-Boot','Salmon-Gibbs'),
         labels = c('Bootstrap\nkallisto','Bootstrap\nSalmon','Gibbs\nSalmon'))

dt.power$Method %<>% mapvalues(from = c('edgeR-SC','edgeR.legacy-SC'),to = c('edgeR-v4','edgeR-v3'))

dt.power[, FDR := roundPretty(ifelse((FP+TP) == 0,NA,100*FP/(FP+TP)),1)]

plot.power <- function(df.bar,df.txt,scenario,library,legend = FALSE, base_size = bs,...){
  tb.bar <- df.bar[Scenario == scenario & LibsPerGroup == library,]
  tb.txt <- df.txt[Scenario == scenario & LibsPerGroup == library,][FDR != 'NA',]
  gap <- 0.05*max(dt.power$TP + dt.power$FP)
  ggplot(tb.bar,aes(x = Quantifier,y = Value,fill = Type)) +
    facet_wrap(facets = "Method",nrow = 1) +
    geom_col() +
    geom_text(aes(x = Quantifier,y = (TP + FP) +  gap,label = FDR),
              vjust = 0,data = tb.txt,size = base_size/.pt,inherit.aes = FALSE) +
    scale_fill_manual(values = c('#ff0000','#bebebe')) +
    labs(x = NULL,y = paste('DE Transcripts')) +
    coord_cartesian(...) +
    theme_bw(base_size = base_size,base_family = 'sans') +
    theme(panel.grid = element_blank(),
          # axis.text.x = element_text(angle = 90),
          axis.text = element_text(colour = 'black',size = base_size),
          strip.text = element_text(size = base_size)) +
    if (legend == TRUE) theme(legend.background = element_rect(fill = alpha('white', 0)),
                              legend.text = element_text(size = base_size),
                              legend.position = 'inside',
                              legend.position.inside = c(0.95,0.825),
                              legend.title = element_blank(),
                              legend.key.size = unit(0.75,"line")) else theme(legend.position = 'none')
}

make.plot.power <- function(x,scenario,library,quantifier,...){
  x.melt <- melt(x,id.vars = colnames(x)[-which(colnames(x) %in% c('P.SIG','TP','FP'))],
                 measure.vars = c('TP','FP'),
                 variable.name = 'Type',
                 value.name = 'Value')

  x.melt <- x.melt[Quantifier %in% quantifier,]
  y <- copy(x[Quantifier %in% quantifier,])

  x.melt$Quantifier <- droplevels(x.melt$Quantifier)
  y$Quantifier <- droplevels(y$Quantifier)

  x.melt$Type <-
    factor(x.melt$Type,
           levels = c('FP','TP'),
           labels = c('False','True'))

  plot.power(df.bar = x.melt,
             df.txt = y,
             scenario = scenario,
             library = library,
             legend = TRUE,
             ...)
}


fig.power.salmon.3 <- make.plot.power(x = dt.power,
                                      scenario = 'Unequal library sizes',
                                      library = '3 samples per group',
                                      quantifier = c('Bootstrap\nSalmon',
                                                     'Gibbs\nSalmon'),
                                      ylim = c(0,3250))
fig.power.salmon.10 <- make.plot.power(x = dt.power,
                                       scenario = 'Unequal library sizes',
                                       library = '10 samples per group',
                                       quantifier = c('Bootstrap\nSalmon',
                                                      'Gibbs\nSalmon'),
                                       ylim = c(0,5000))

fig.power.kallisto.3 <- make.plot.power(x = dt.power,
                                        scenario = 'Unequal library sizes',
                                        library = '3 samples per group',
                                        quantifier = c('Bootstrap\nkallisto',
                                                       'Gibbs\nSalmon'),
                                        ylim = c(0,3250))
fig.power.kallisto.5 <- make.plot.power(x = dt.power,
                                        scenario = 'Unequal library sizes',
                                        library = '5 samples per group',
                                        quantifier = c('Bootstrap\nkallisto',
                                                       'Gibbs\nSalmon'),
                                        ylim = c(0,3250))
fig.power.kallisto.10 <- make.plot.power(x = dt.power,
                                         scenario = 'Unequal library sizes',
                                         library = '10 samples per group',
                                         quantifier = c('Bootstrap\nkallisto',
                                                        'Gibbs\nSalmon'),
                                         ylim = c(0,5000))

fig.power.salmon.3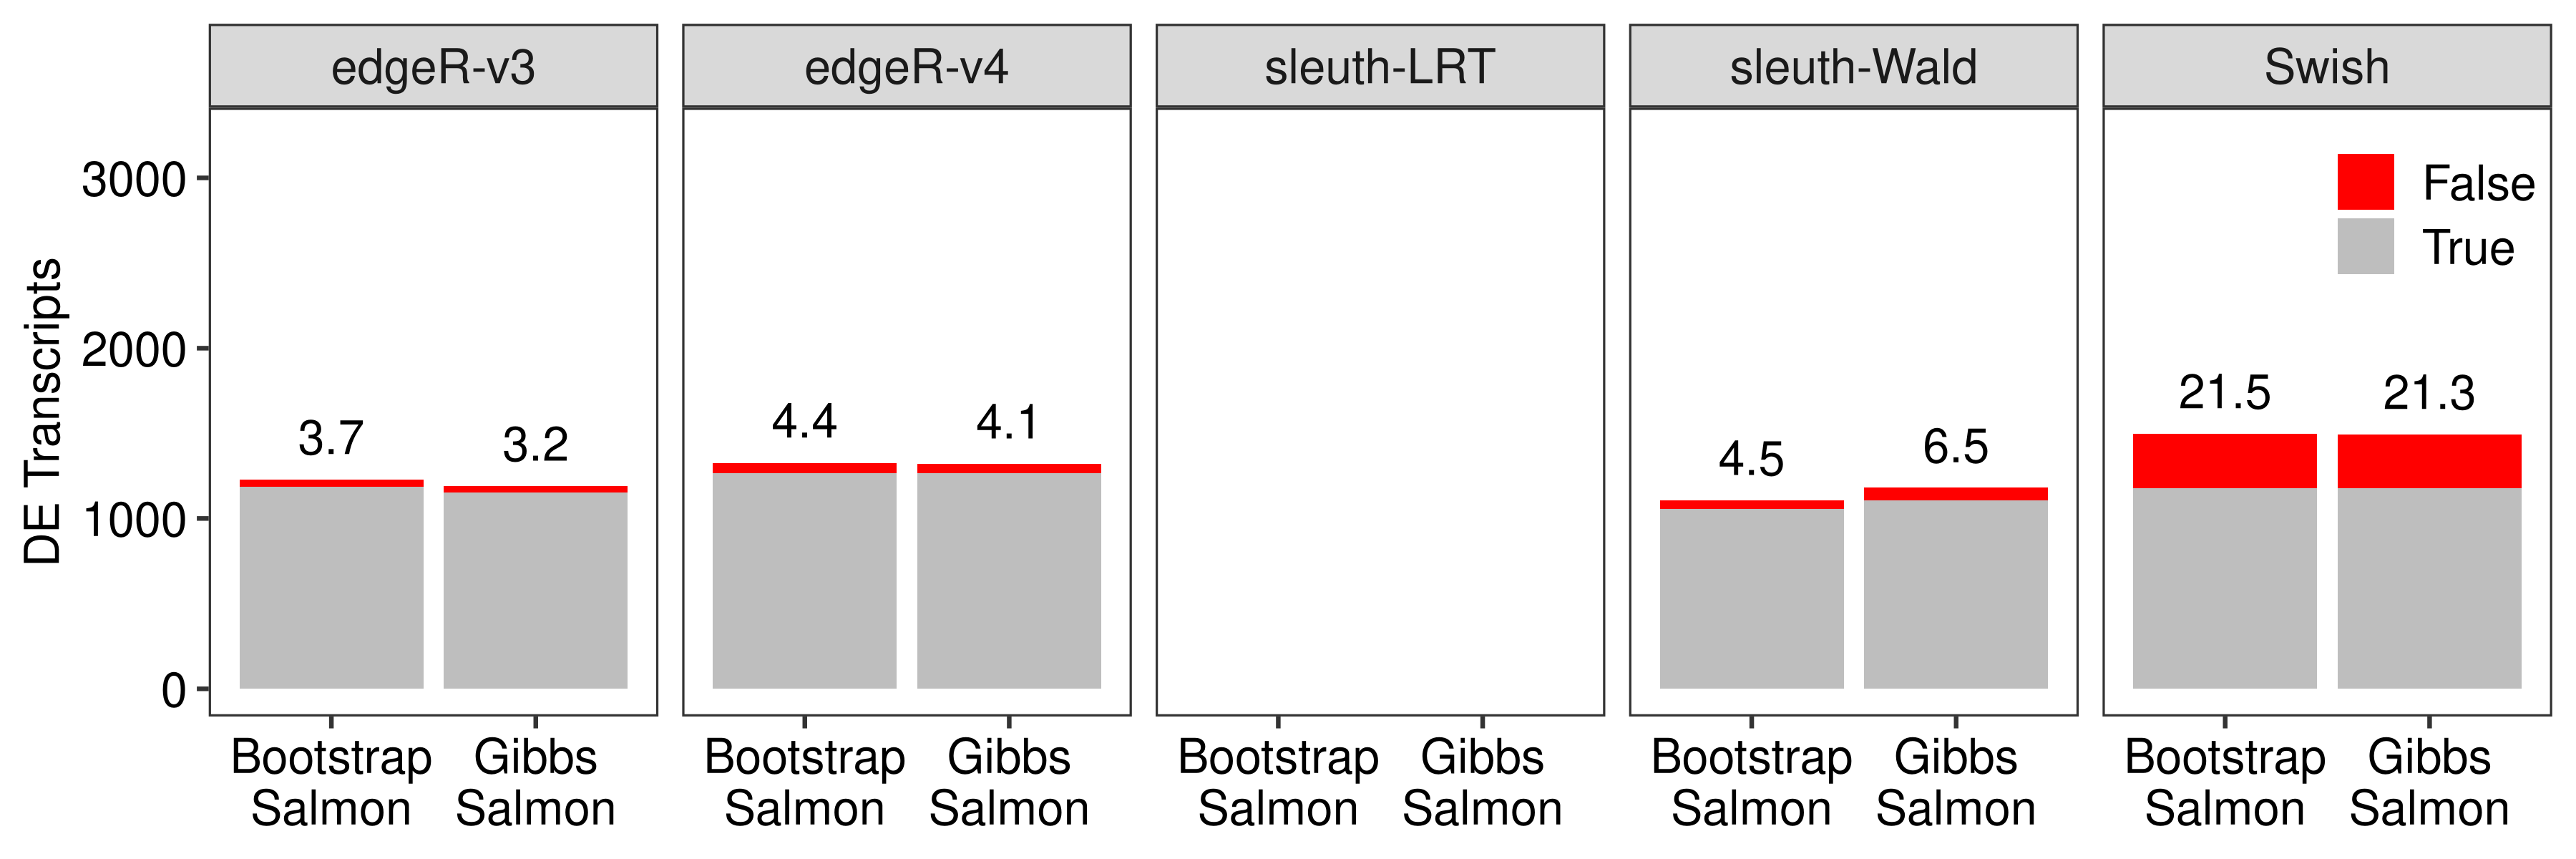
fig.power.salmon.10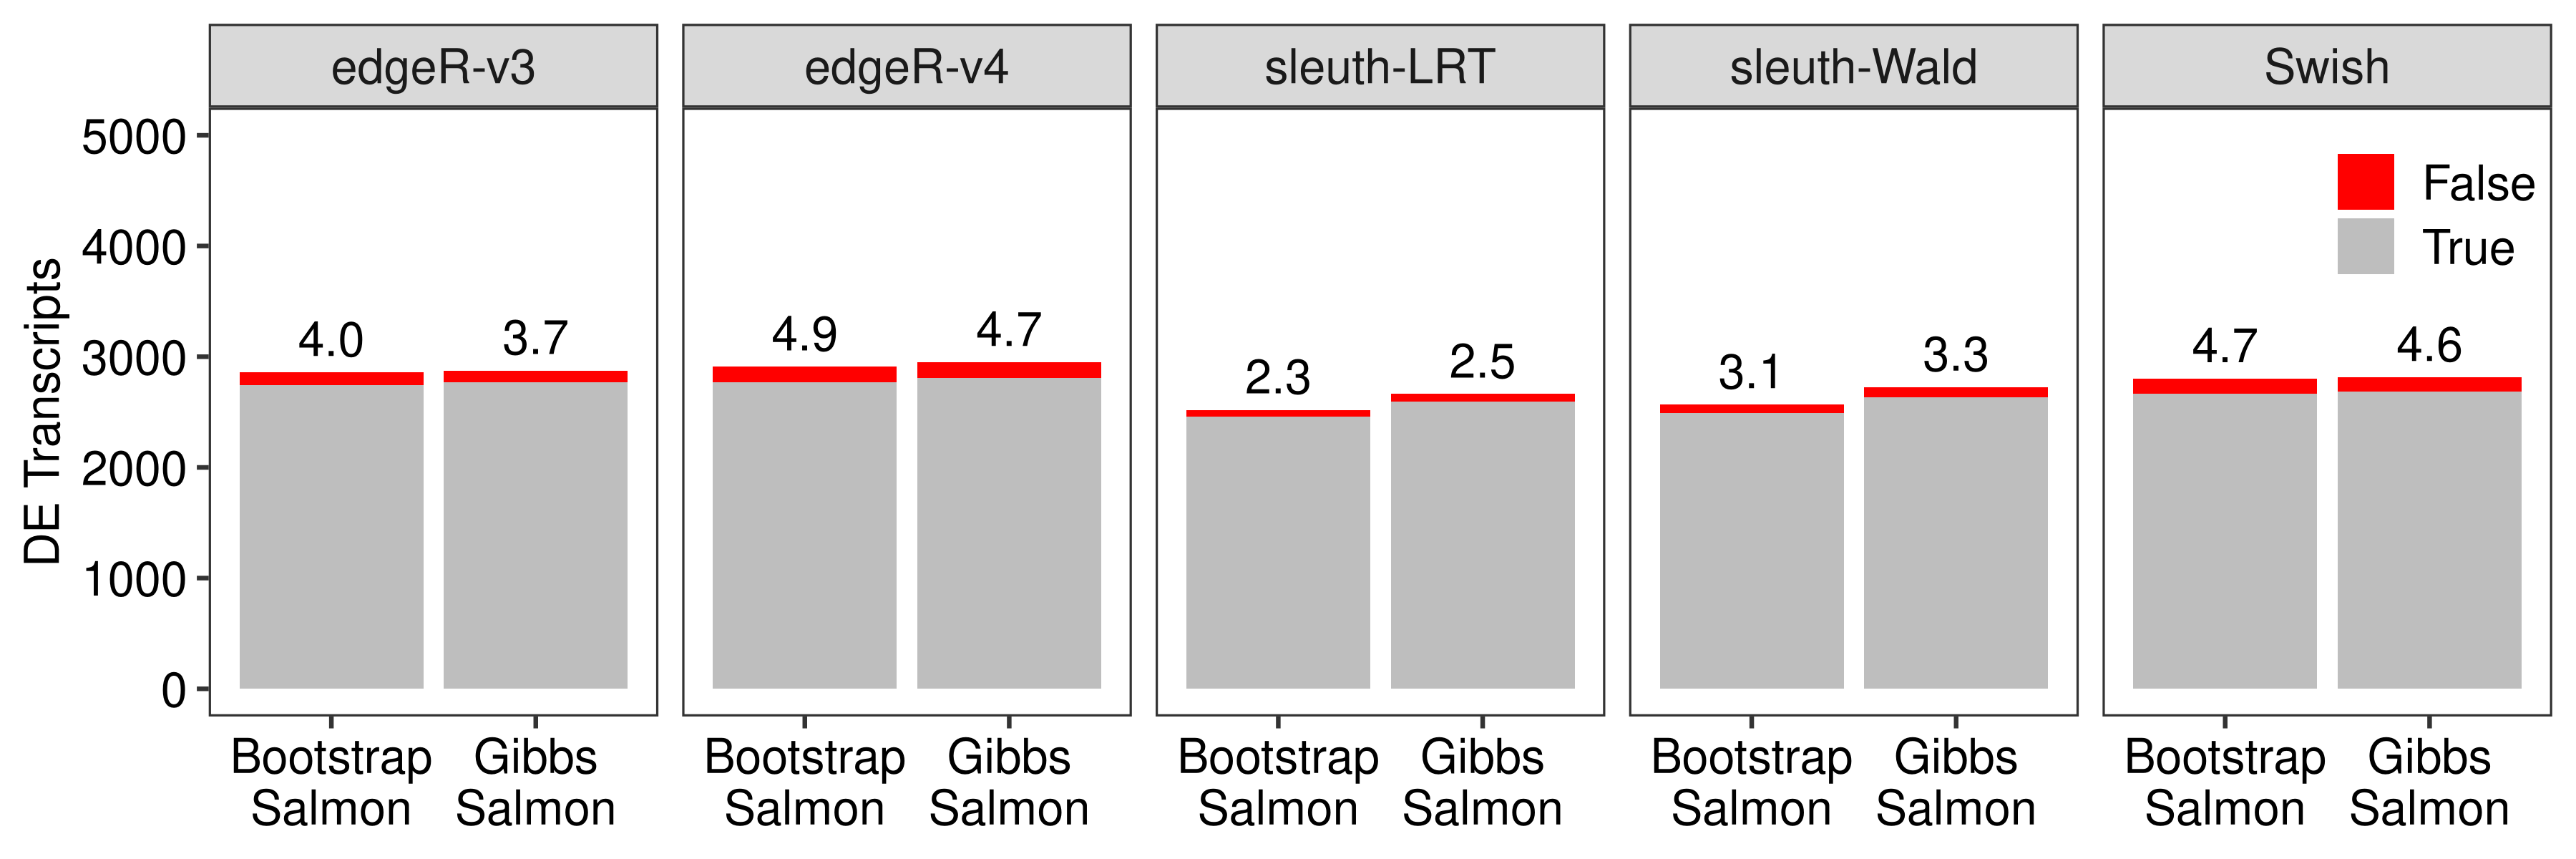
fig.power.kallisto.3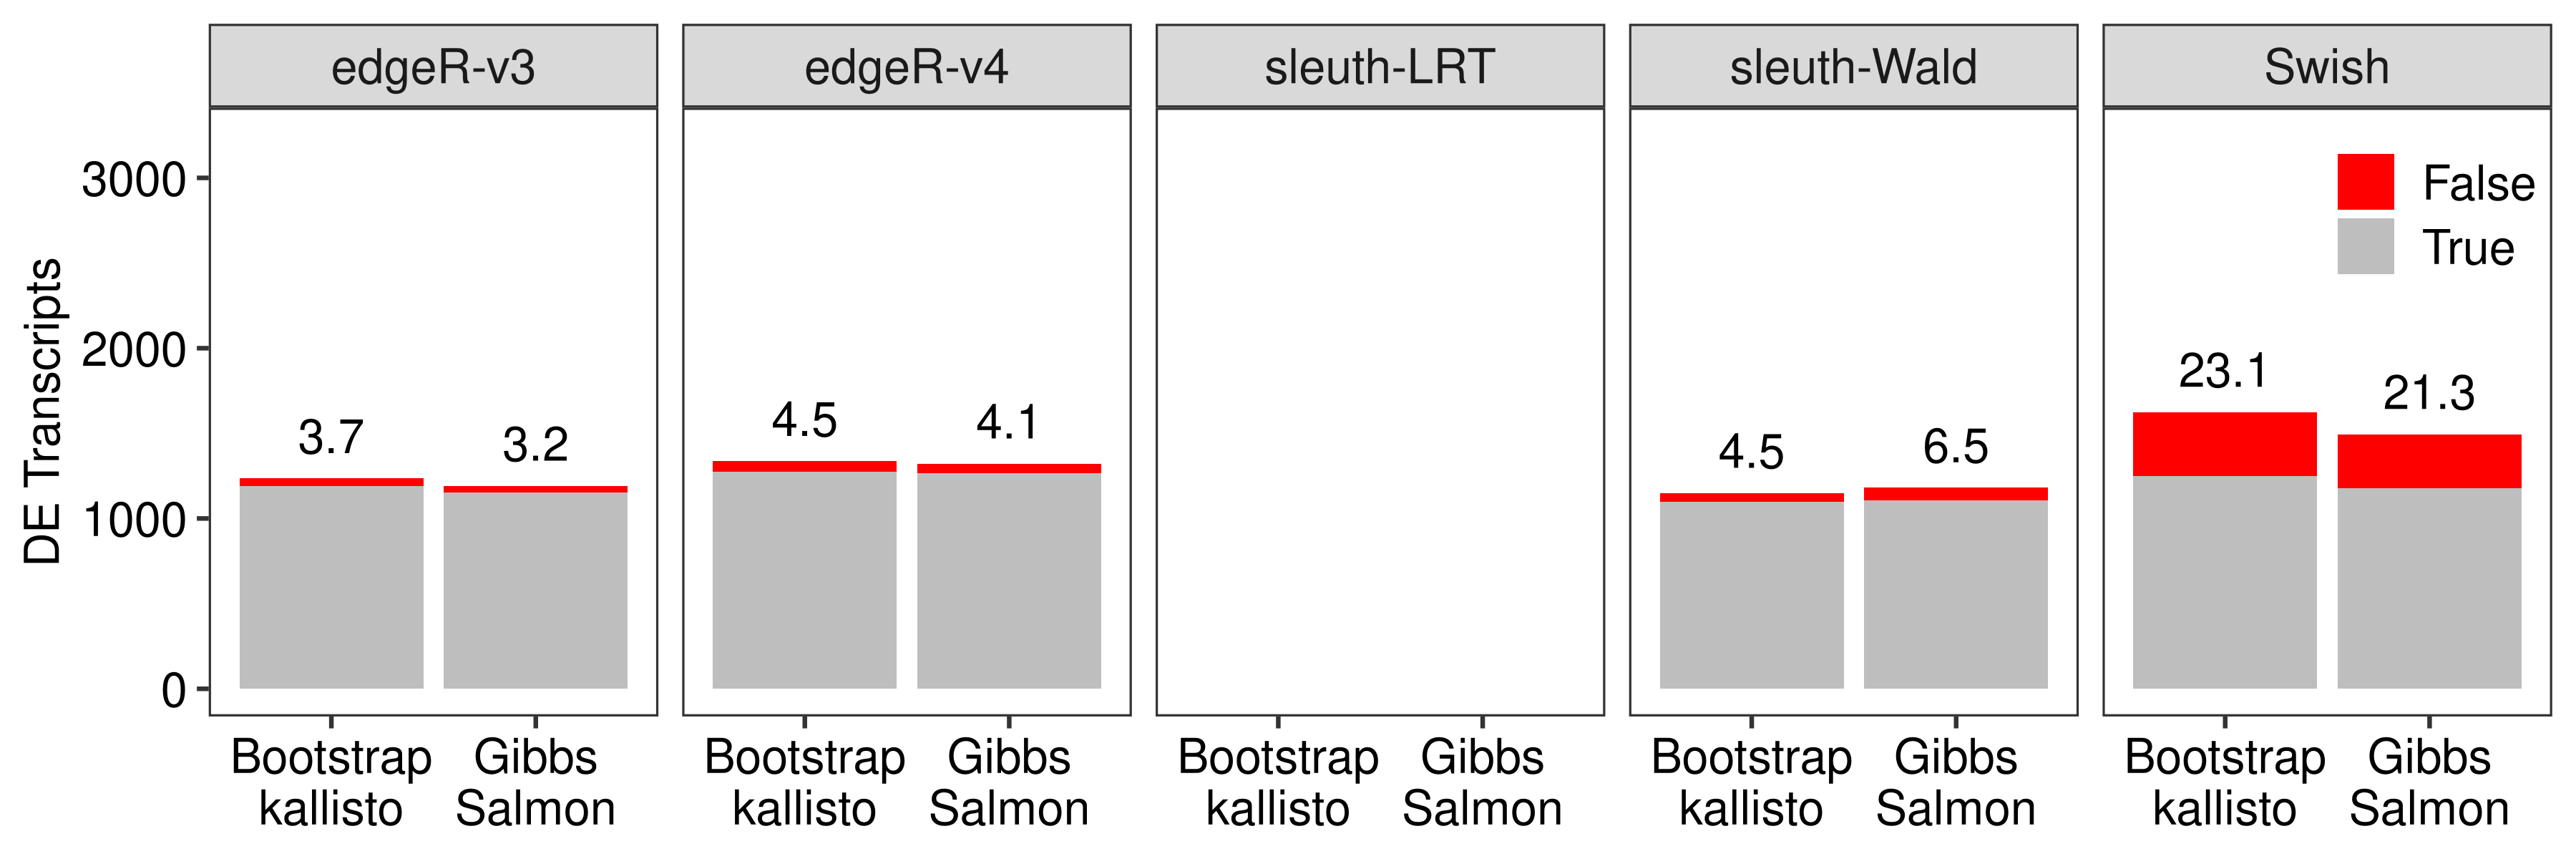
fig.power.kallisto.5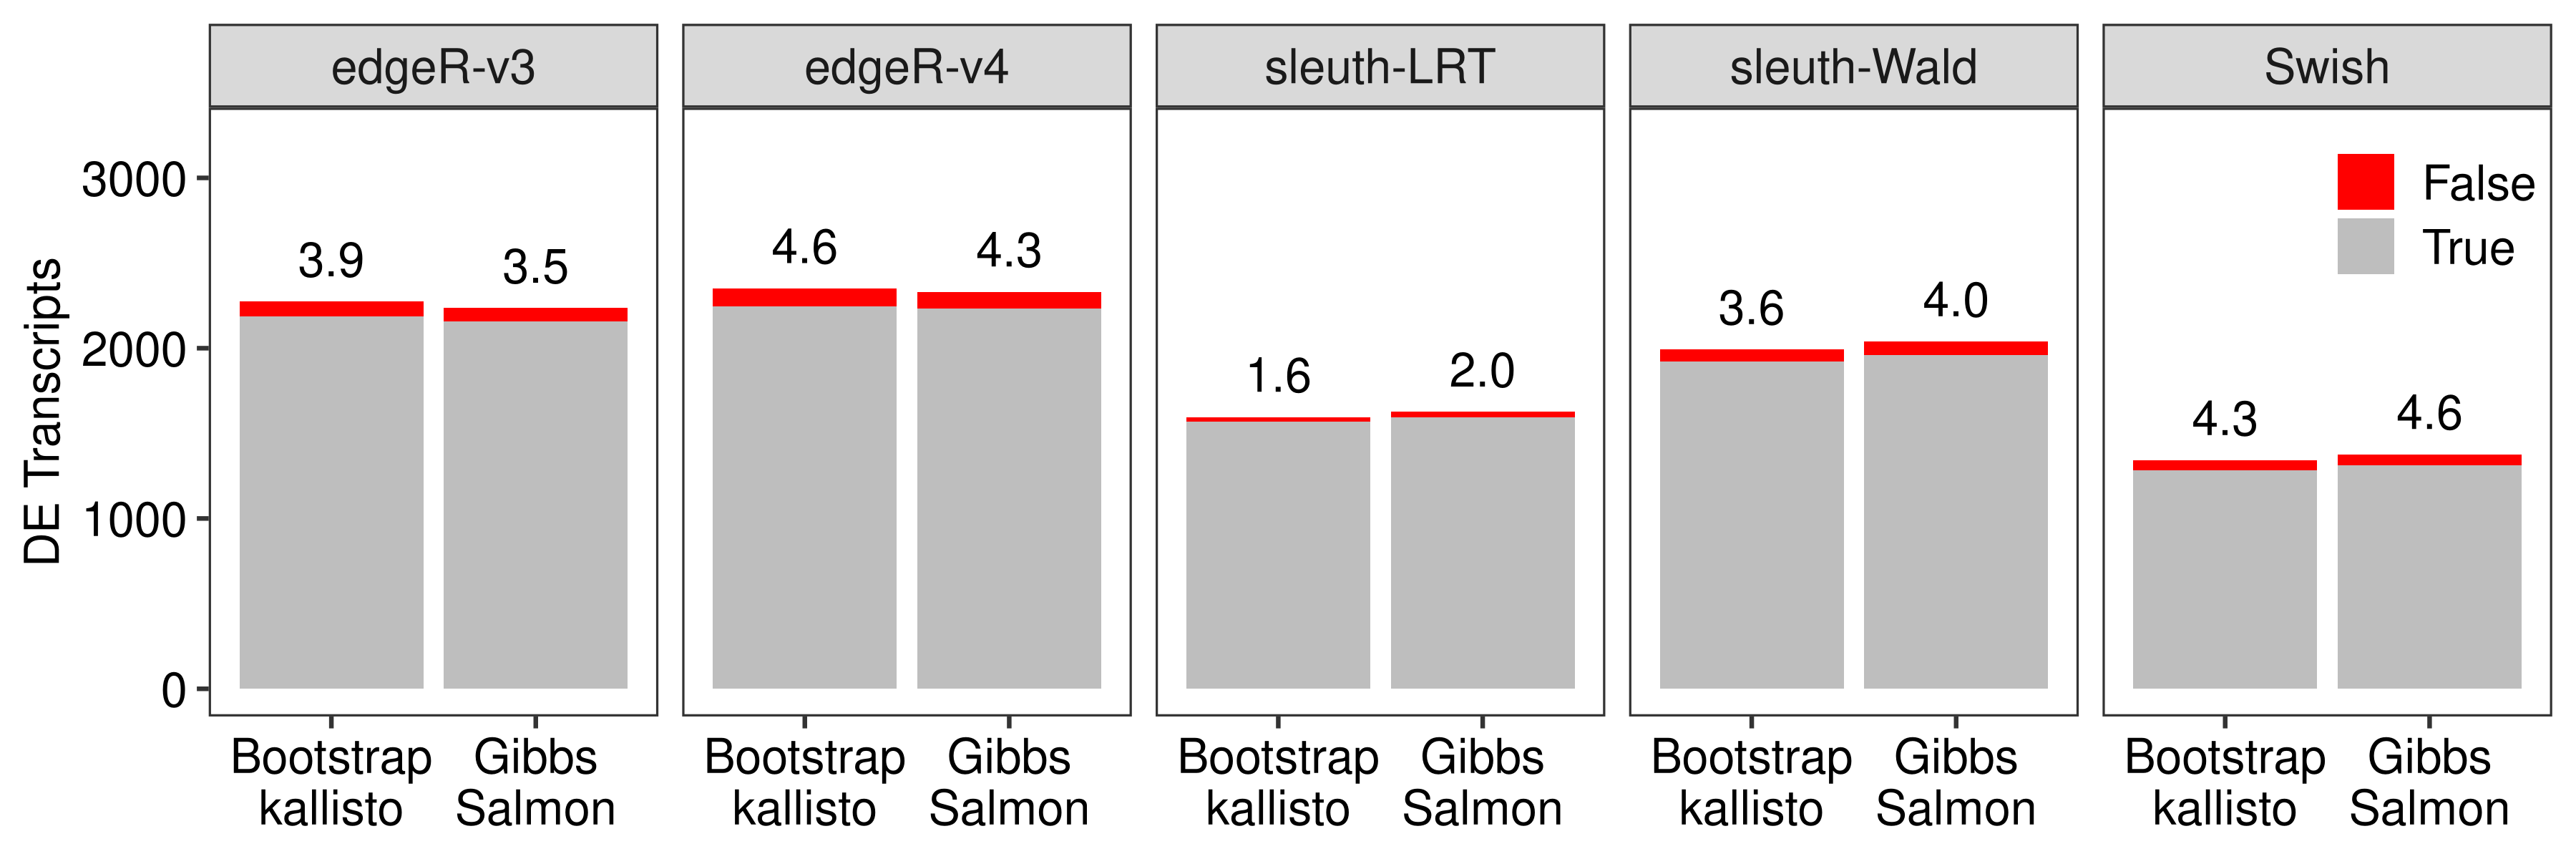
fig.power.kallisto.10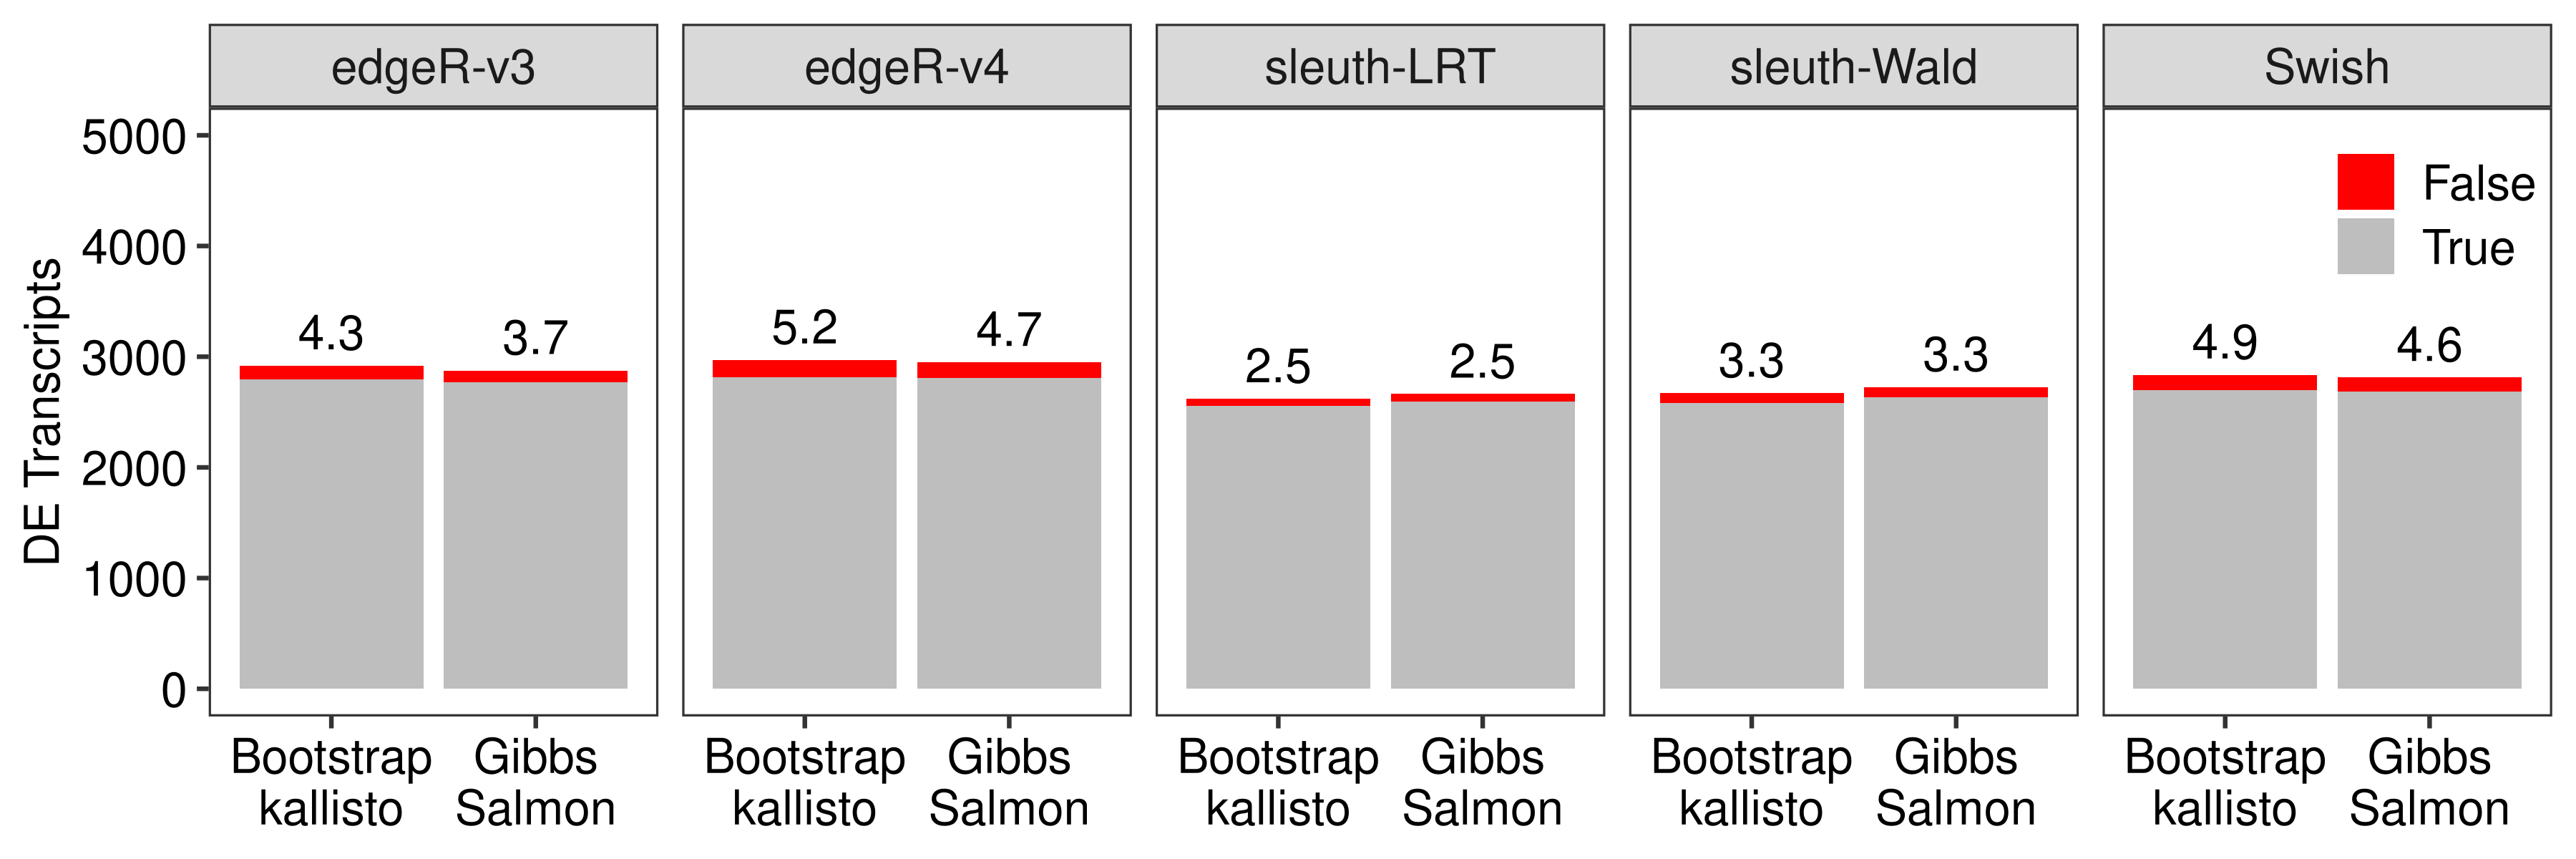
FDR
Below I compute the false discovery curves of Supplementary Figures S4–S8.
dt.fdr.plot <- dt.fdr[FC == 'fc2' &
                        !grepl("\\.n|RC",Method) &
                        Scenario == 'unbalanced',]

colmeth <- methodsNames()$color
names(colmeth) <- gsub('^edgeR-SC$','edgeR-v4',names(colmeth))
names(colmeth) <- gsub('^edgeR.legacy-SC$','edgeR-v3',names(colmeth))

dt.fdr.plot$LibsPerGroup %<>% factor(levels = paste0('#Lib/Group = ', c(3, 5,10)),labels = paste0(c(3,5,10),' samples per group'))
dt.fdr.plot$Scenario %<>% factor(levels = c('balanced','unbalanced'),labels = c('Equal library sizes','Unequal library sizes'))
dt.fdr.plot$Quantifier %<>%
  factor(levels = c('Salmon-Gibbs','kallisto','Salmon-Boot'),
         labels = c('Gibbs\nSalmon','Bootstrap\nkallisto','Bootstrap\nSalmon'))
dt.fdr.plot$Method %<>% mapvalues(from = c('edgeR-SC','edgeR.legacy-SC'),to = c('edgeR-v4','edgeR-v3'))

dt.fdr.plot$Method %<>% factor(levels = c('Swish',
                                          'sleuth-Wald',
                                          'sleuth-LRT',
                                          'edgeR-v3',
                                          'edgeR-v4'))

plot.fdr <- function(df.line,scenario,library,legend = FALSE,base_size = bs,color = colmeth,...){
  tb.bar <- df.line[Scenario == scenario & LibsPerGroup == library,]

  ggplot(tb.bar,aes(x = N,y = FDR,color = Method,linetype = Quantifier)) +
    geom_line(linewidth = 0.7) +
    scale_color_manual(values = color,
                       breaks = c('edgeR-v3',
                                  'edgeR-v4',
                                  'sleuth-LRT',
                                  'sleuth-Wald',
                                  'Swish')) +
    coord_cartesian(...) +
    labs(y = 'False discoveries',x = 'Transcripts chosen') +
    theme_bw(base_size = base_size,base_family = 'sans') +
    theme(panel.grid = element_blank(),
          axis.text = element_text(colour = 'black',size = base_size)) +
    if (legend == TRUE) theme(legend.background = element_rect(fill = alpha('white', 0)),
                              legend.direction = 'vertical',
                              legend.box = 'horizontal',
                              legend.position = c(0.2,0.9),
                              legend.text = element_text(size = base_size),
                              legend.title = element_blank(),
                              legend.key.size = unit(0.75,"line")) else theme(legend.position = 'none')
}

fig.fdr.salmon.3 <- plot.fdr(df.line = dt.fdr.plot[Quantifier %in% c('Bootstrap\nSalmon','Gibbs\nSalmon'),],
                             scenario = 'Unequal library sizes',
                             library = '3 samples per group',
                             ylim = c(0,750),
                             xlim = c(0,2500),
                             legend = TRUE)
Warning: A numeric `legend.position` argument in `theme()` was deprecated in ggplot2
3.5.0.
ℹ Please use the `legend.position.inside` argument of `theme()` instead.
This warning is displayed once every 8 hours.
Call `lifecycle::last_lifecycle_warnings()` to see where this warning was
generated.fig.fdr.salmon.10 <- plot.fdr(df.line = dt.fdr.plot[Quantifier %in% c('Bootstrap\nSalmon','Gibbs\nSalmon'),],
scenario = 'Unequal library sizes',
library = '10 samples per group',
ylim = c(0,300),
xlim = c(1000,3000),
legend = TRUE)
fig.fdr.kallisto.3 <- plot.fdr(df.line = dt.fdr.plot[Quantifier %in% c('Bootstrap\nkallisto','Gibbs\nSalmon'),],
scenario = 'Unequal library sizes',
library = '3 samples per group',
ylim = c(0,750),
xlim = c(0,2500),
legend = TRUE)
fig.fdr.kallisto.5 <- plot.fdr(df.line = dt.fdr.plot[Quantifier %in% c('Bootstrap\nkallisto','Gibbs\nSalmon'),],
scenario = 'Unequal library sizes',
library = '5 samples per group',
ylim = c(0,400),
xlim = c(0,2500),
legend = TRUE)
fig.fdr.kallisto.10 <- plot.fdr(df.line = dt.fdr.plot[Quantifier %in% c('Bootstrap\nkallisto','Gibbs\nSalmon'),],
scenario = 'Unequal library sizes',
library = '10 samples per group',
ylim = c(0,300),
xlim = c(1000,3000),
legend = TRUE)
fig.fdr.salmon.3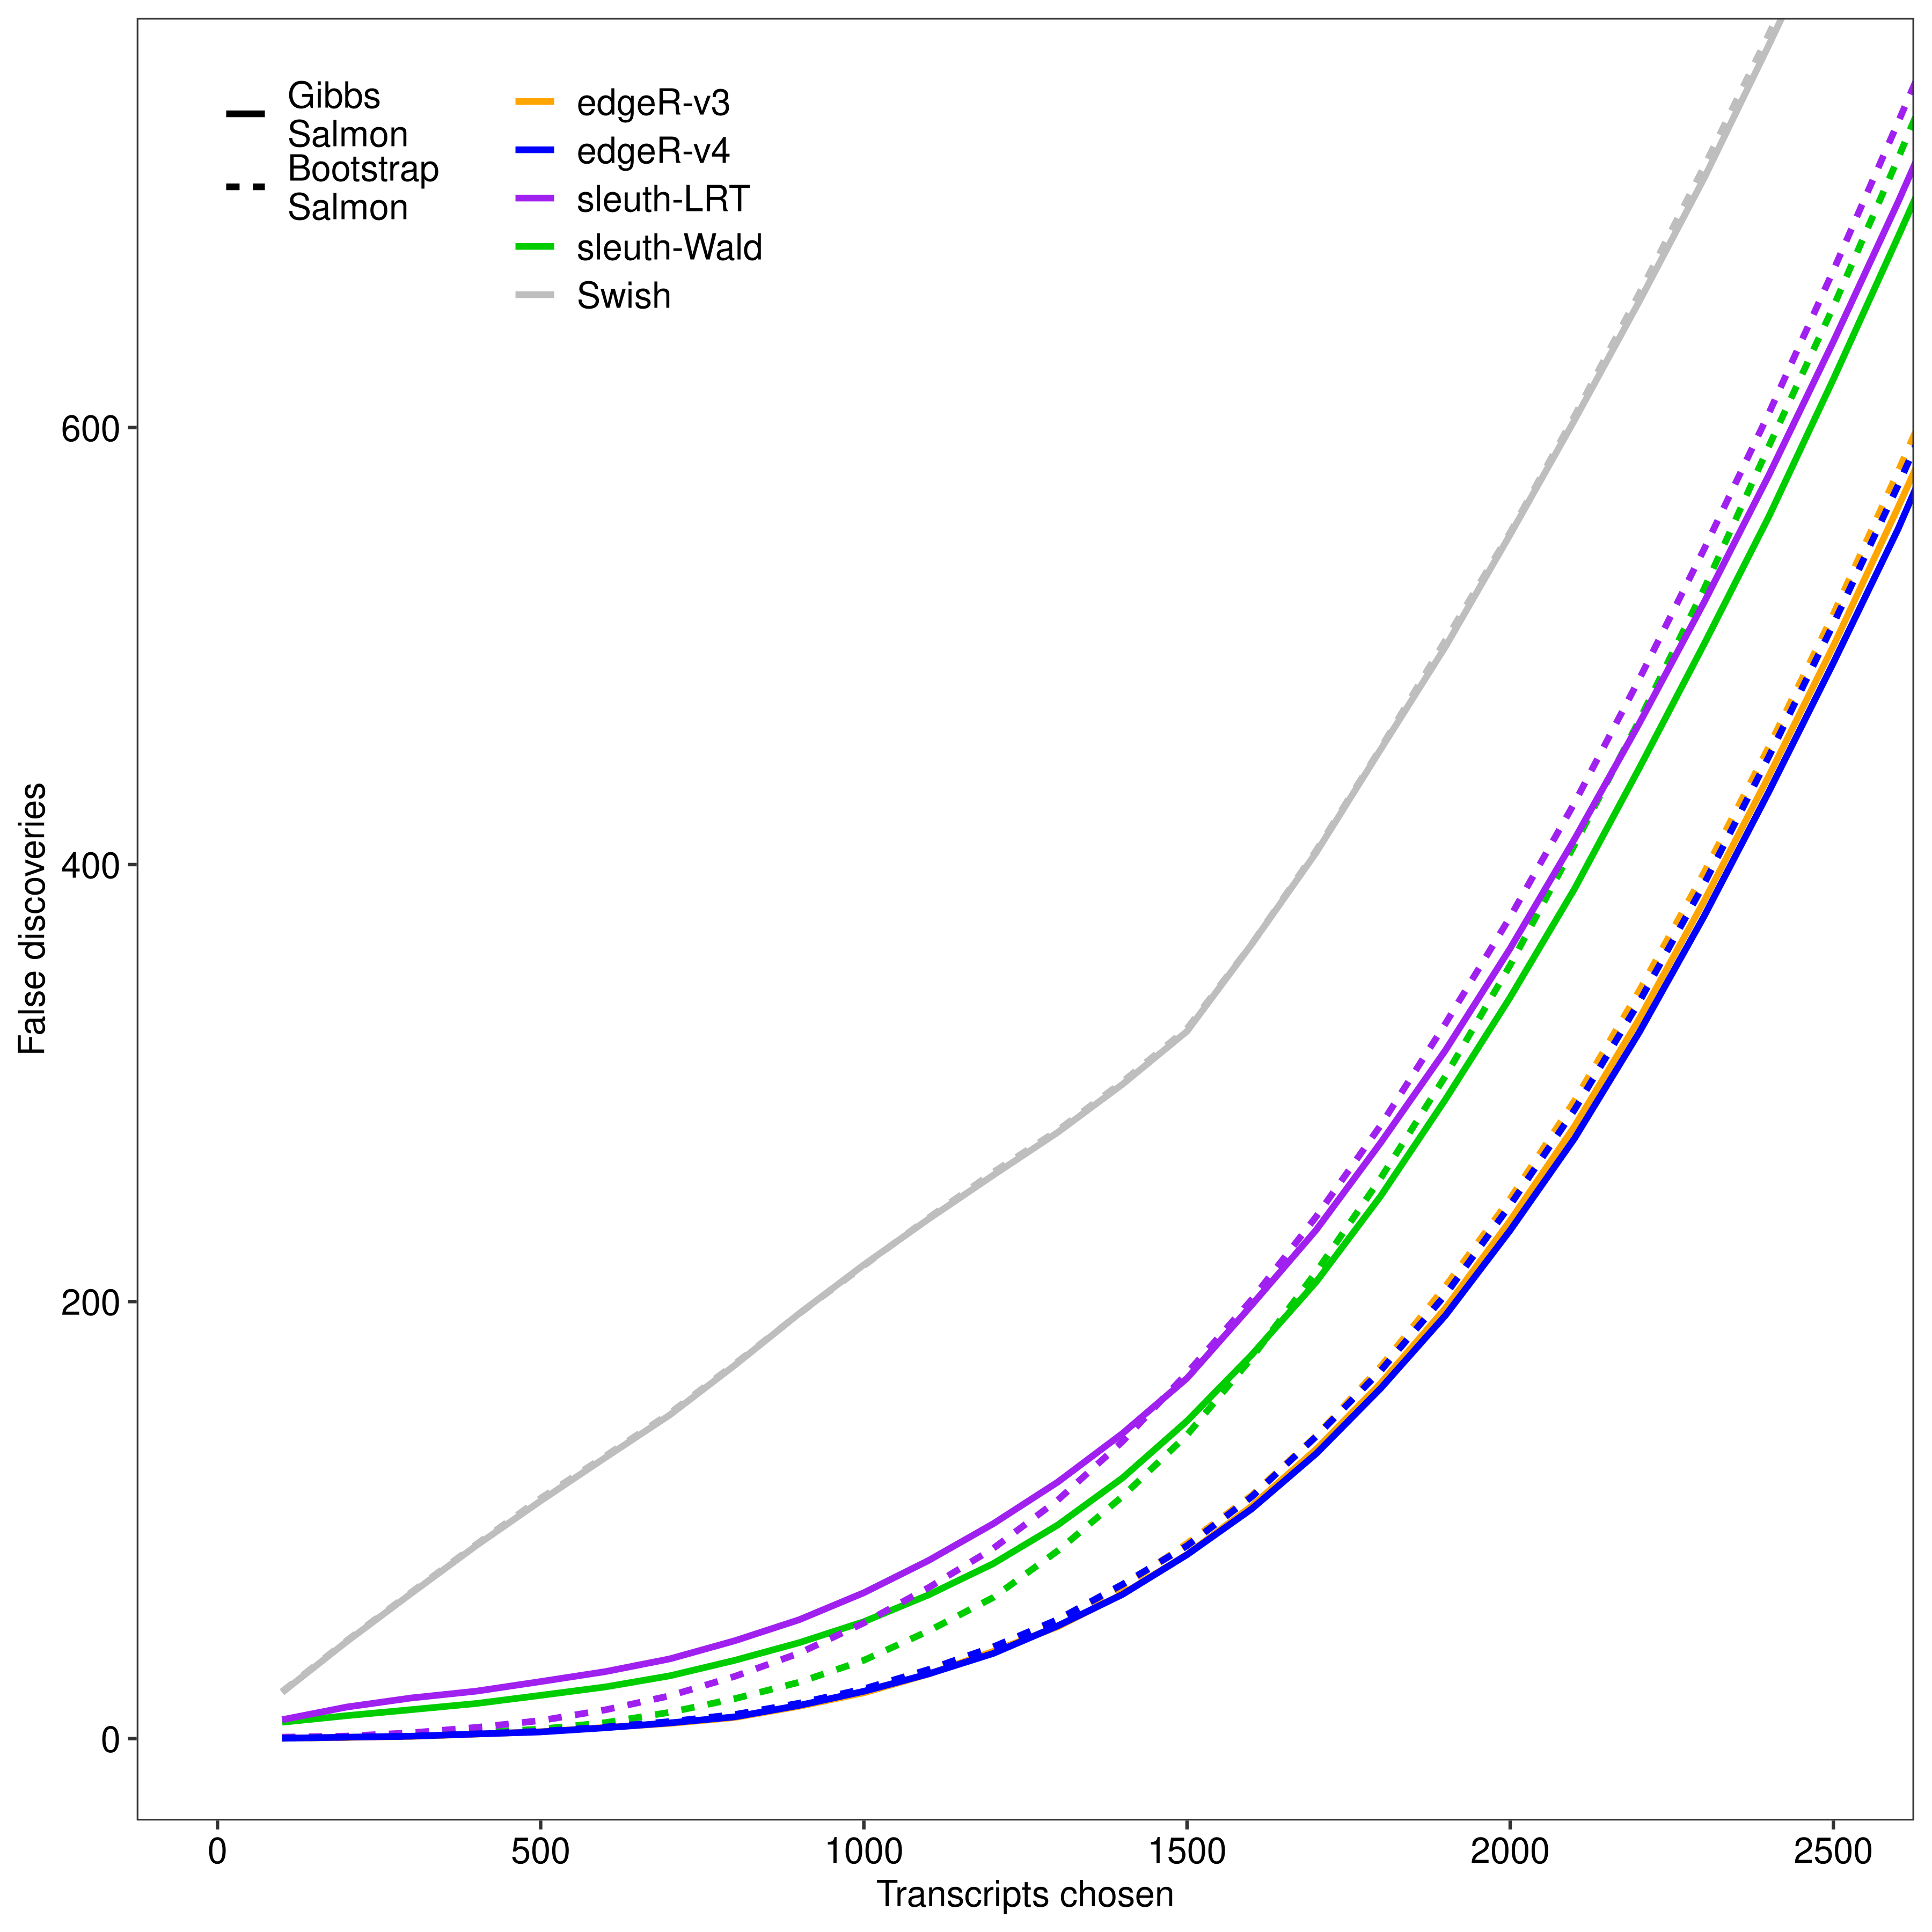
fig.fdr.salmon.10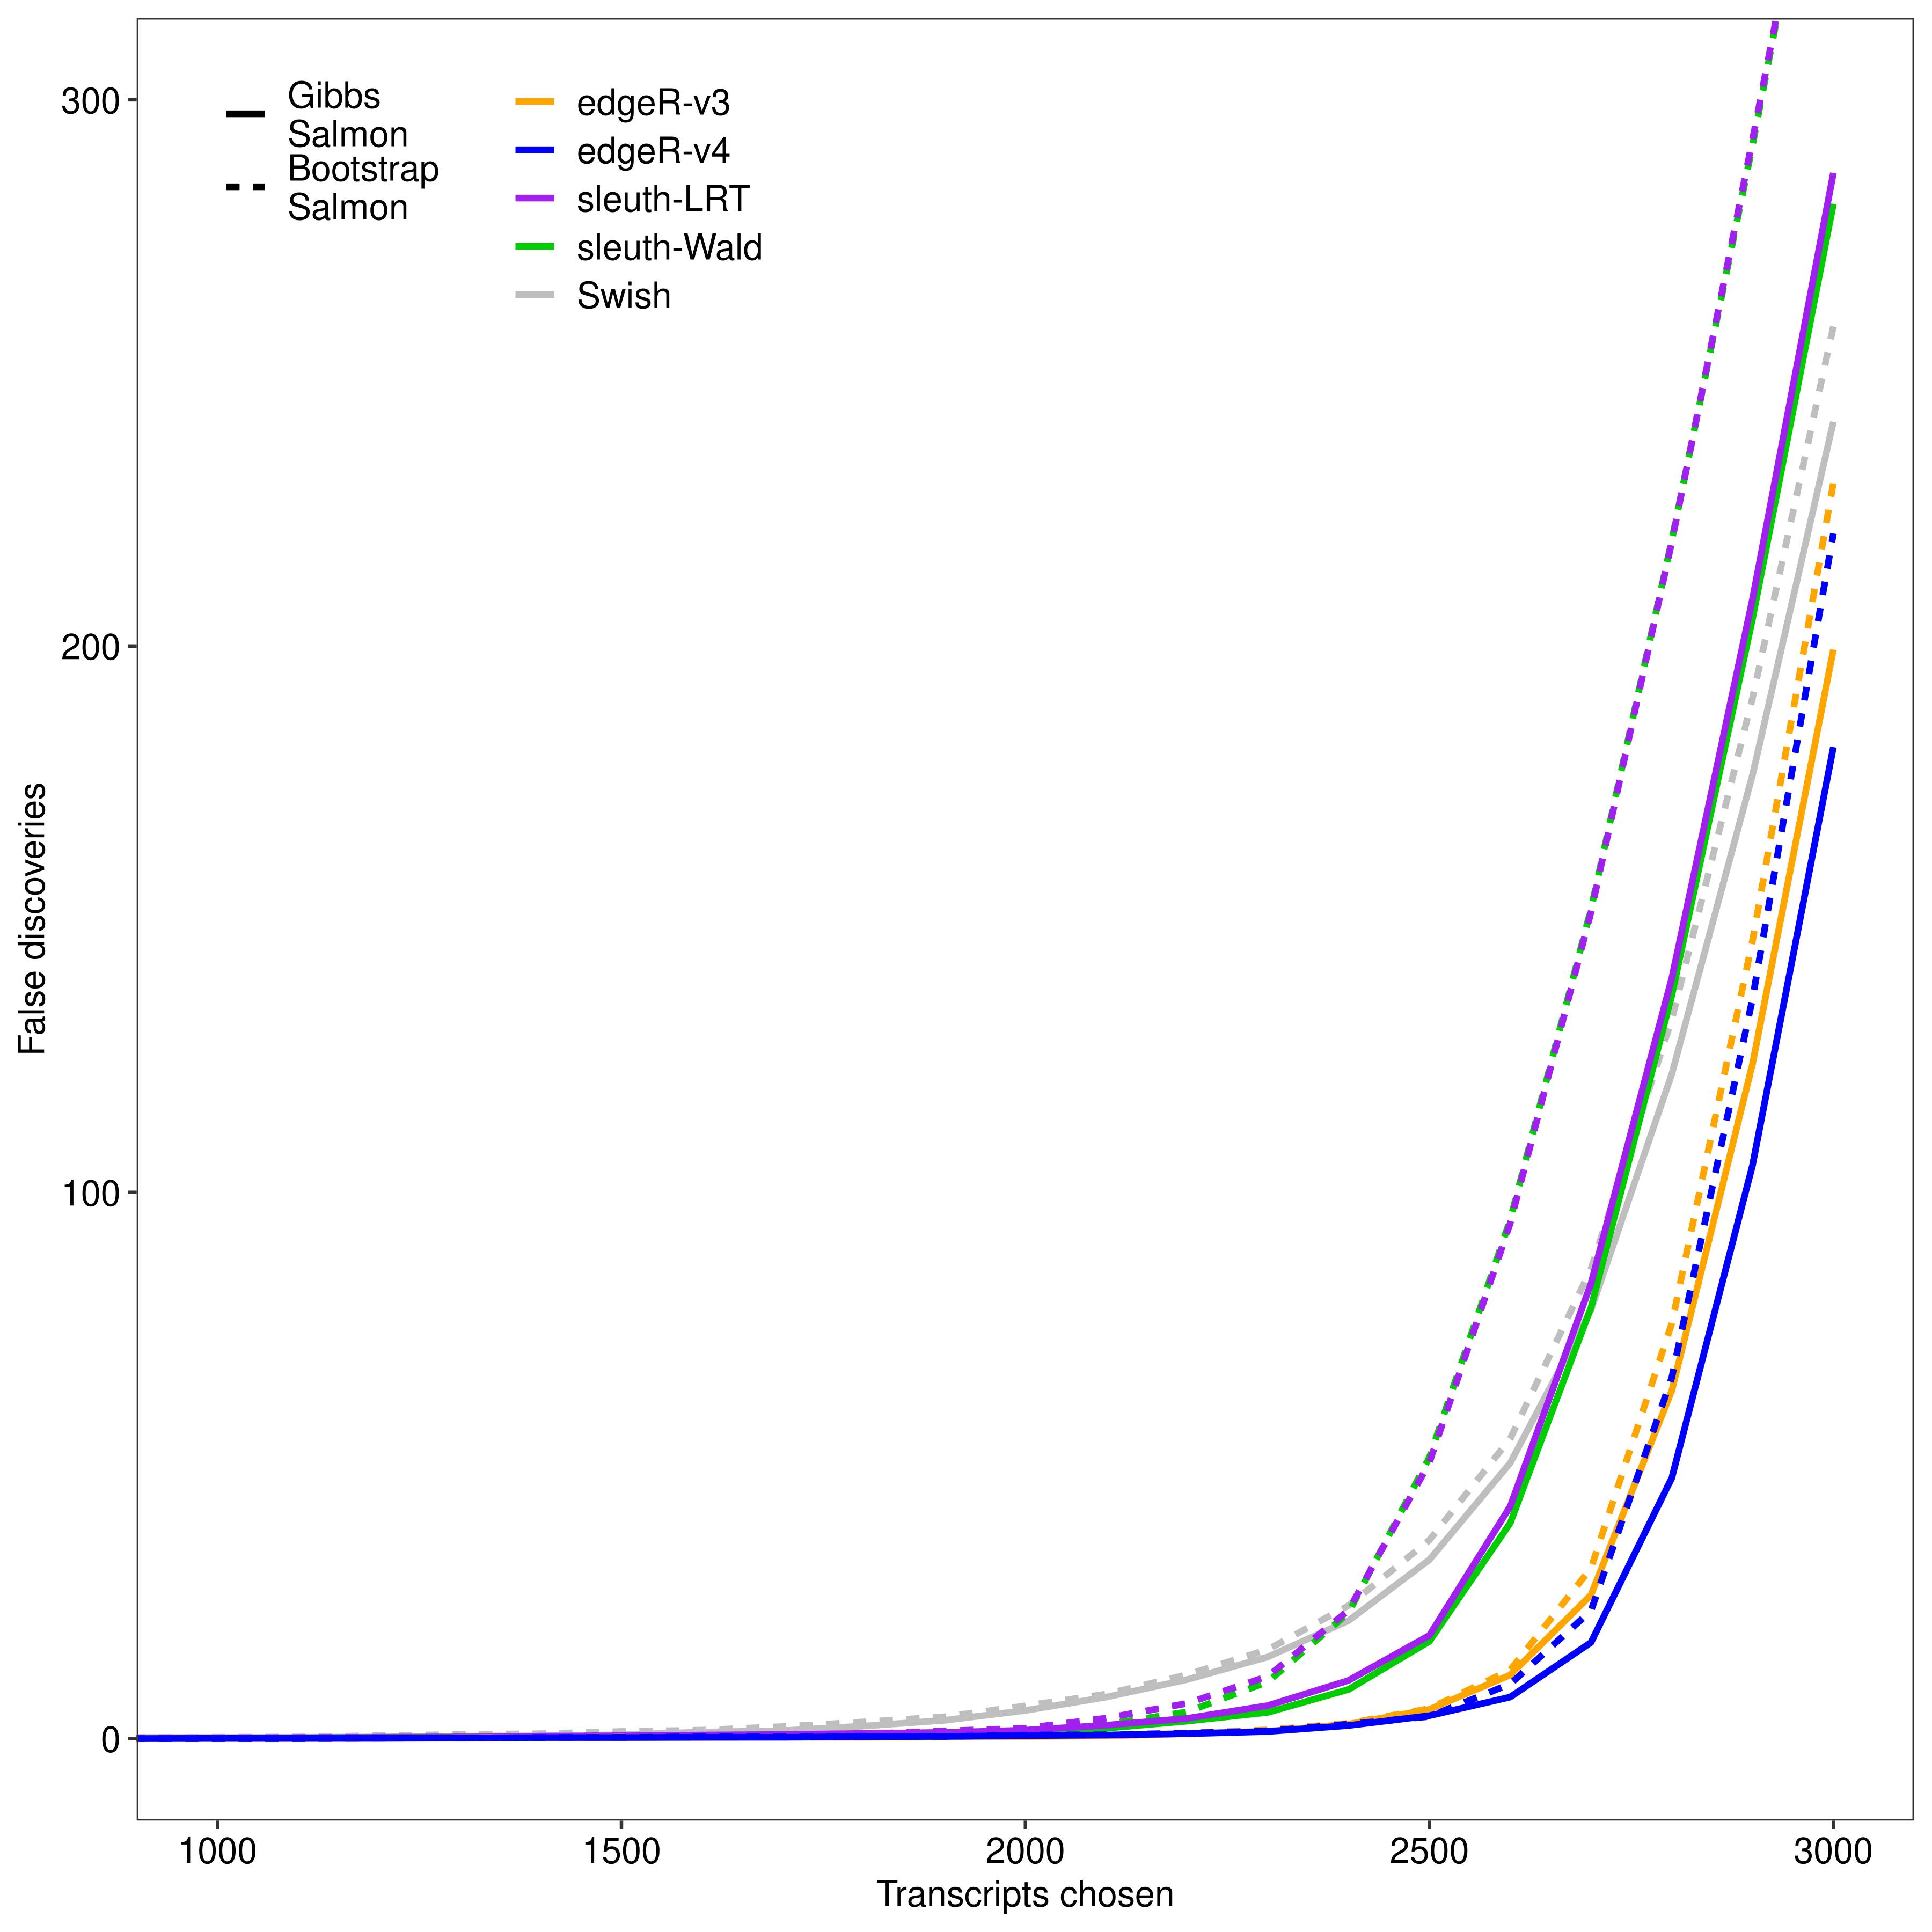
fig.fdr.kallisto.3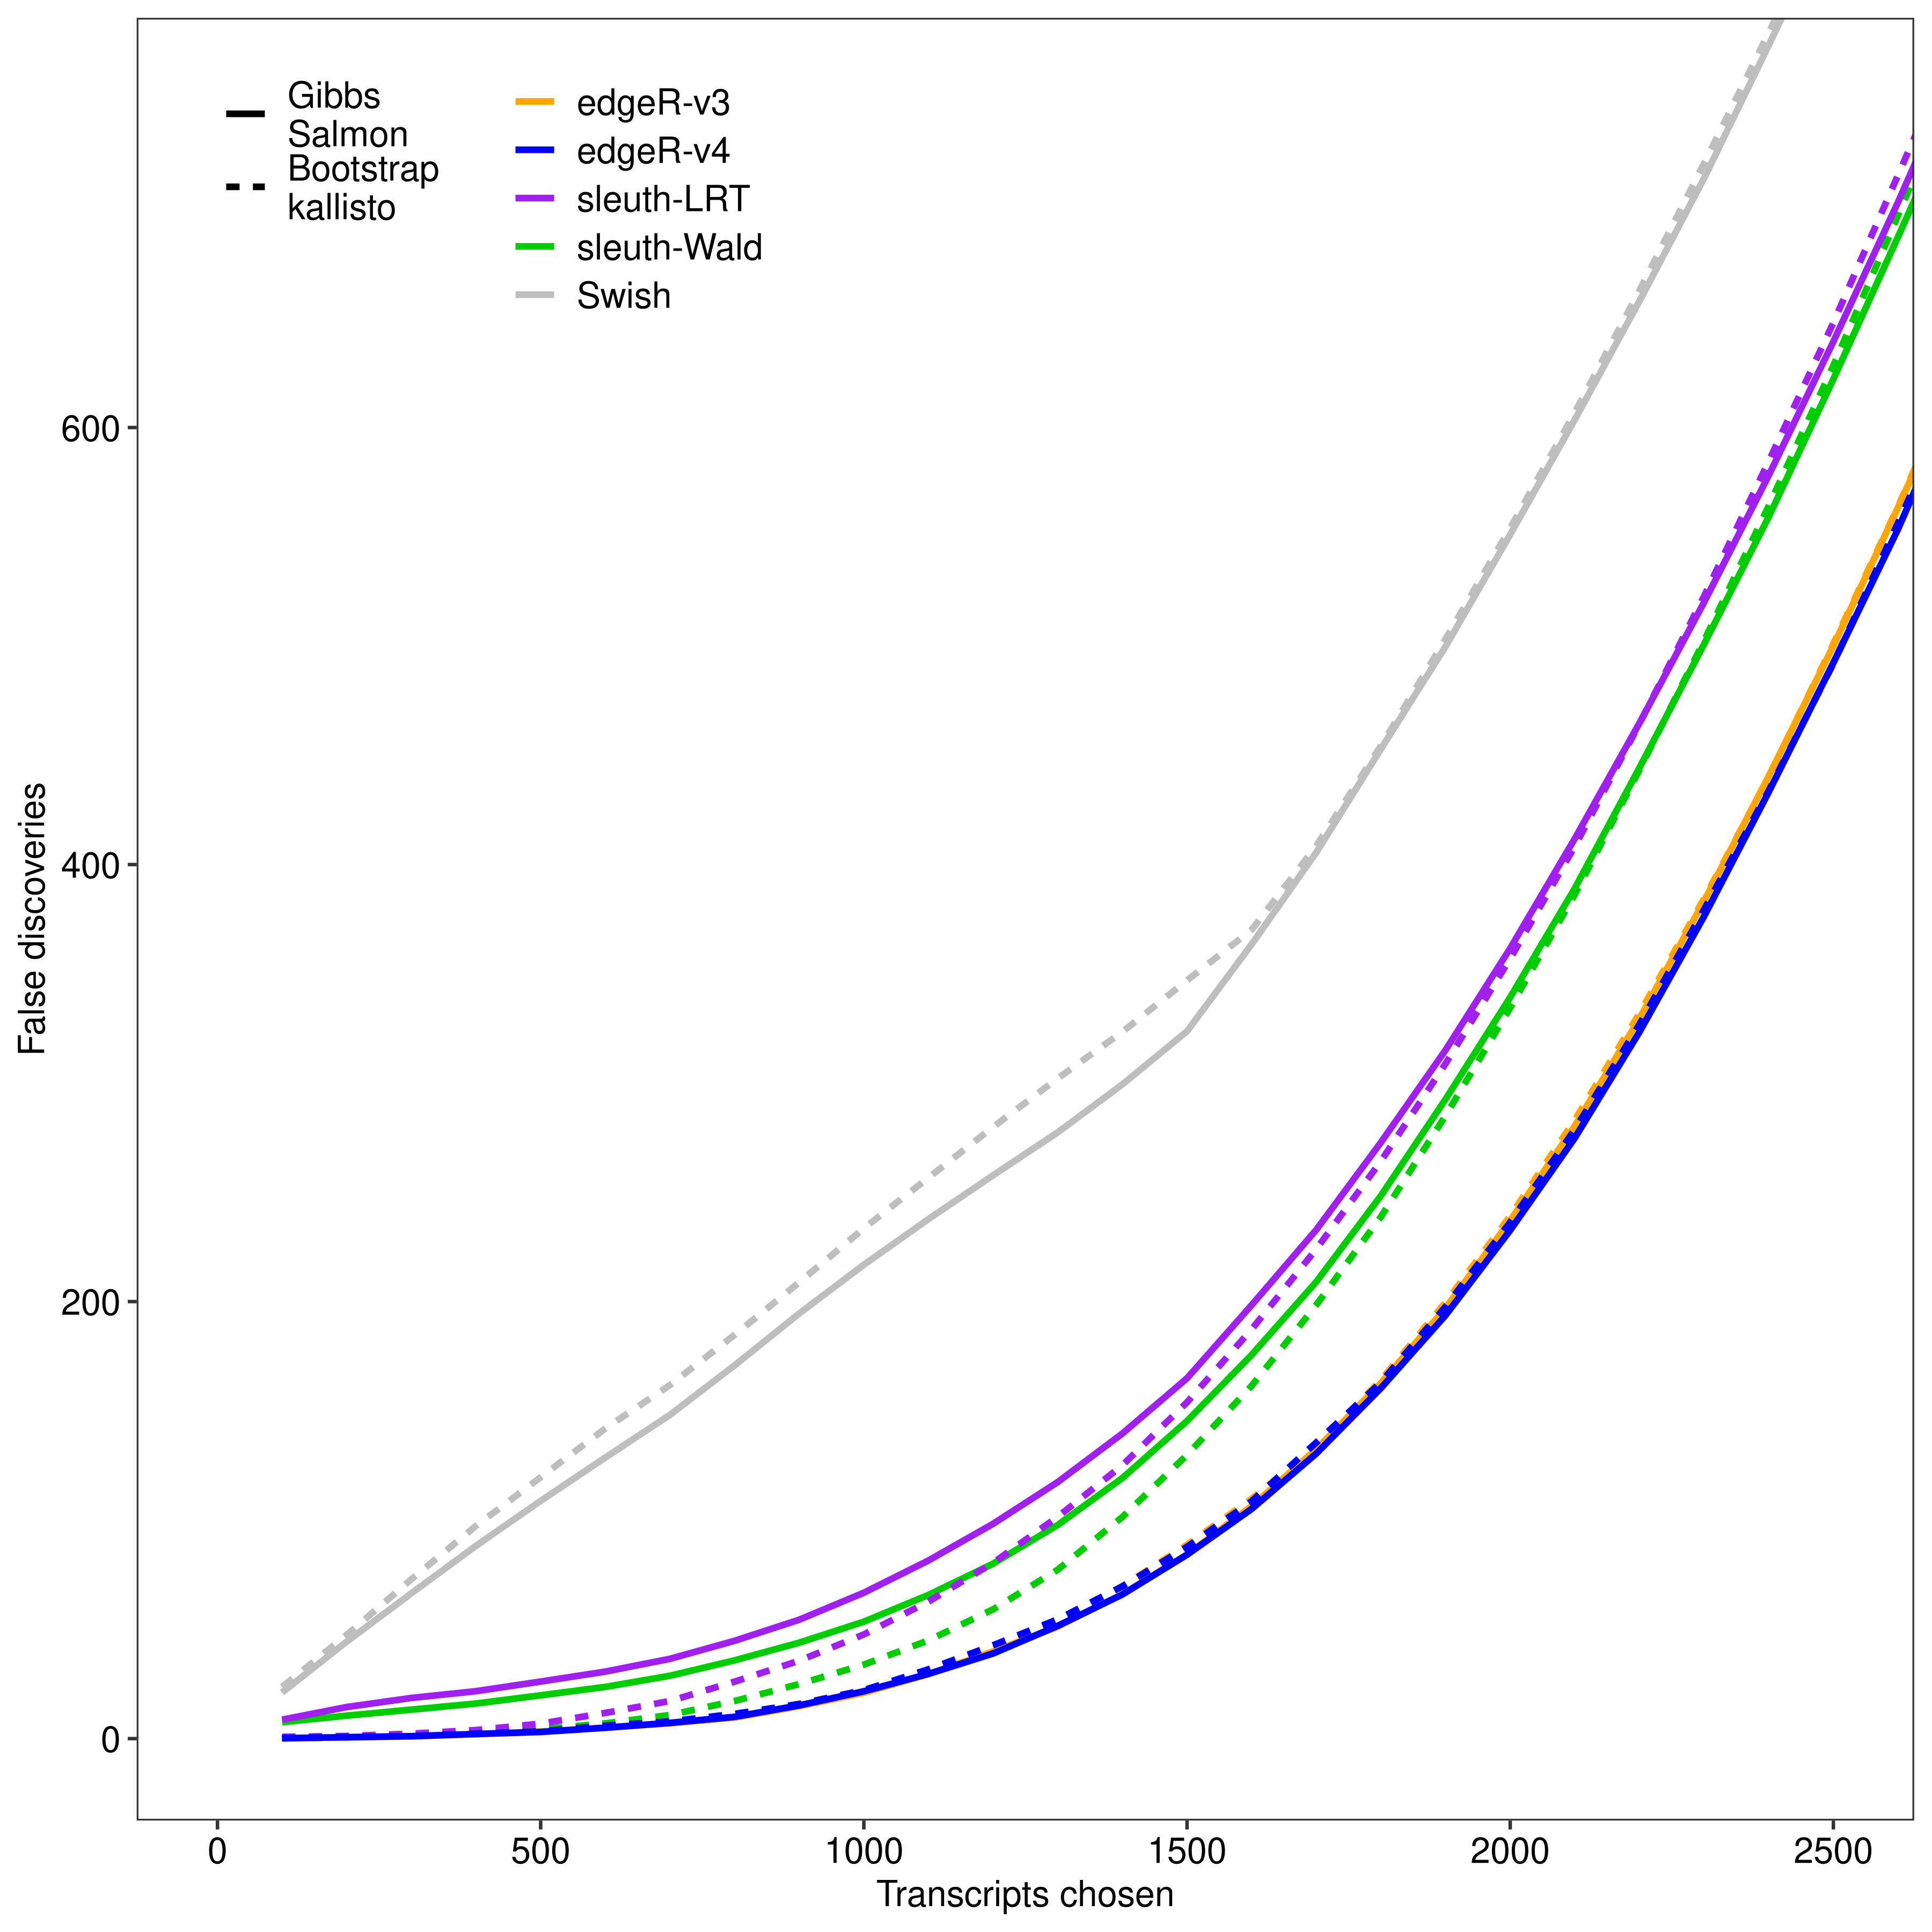
fig.fdr.kallisto.5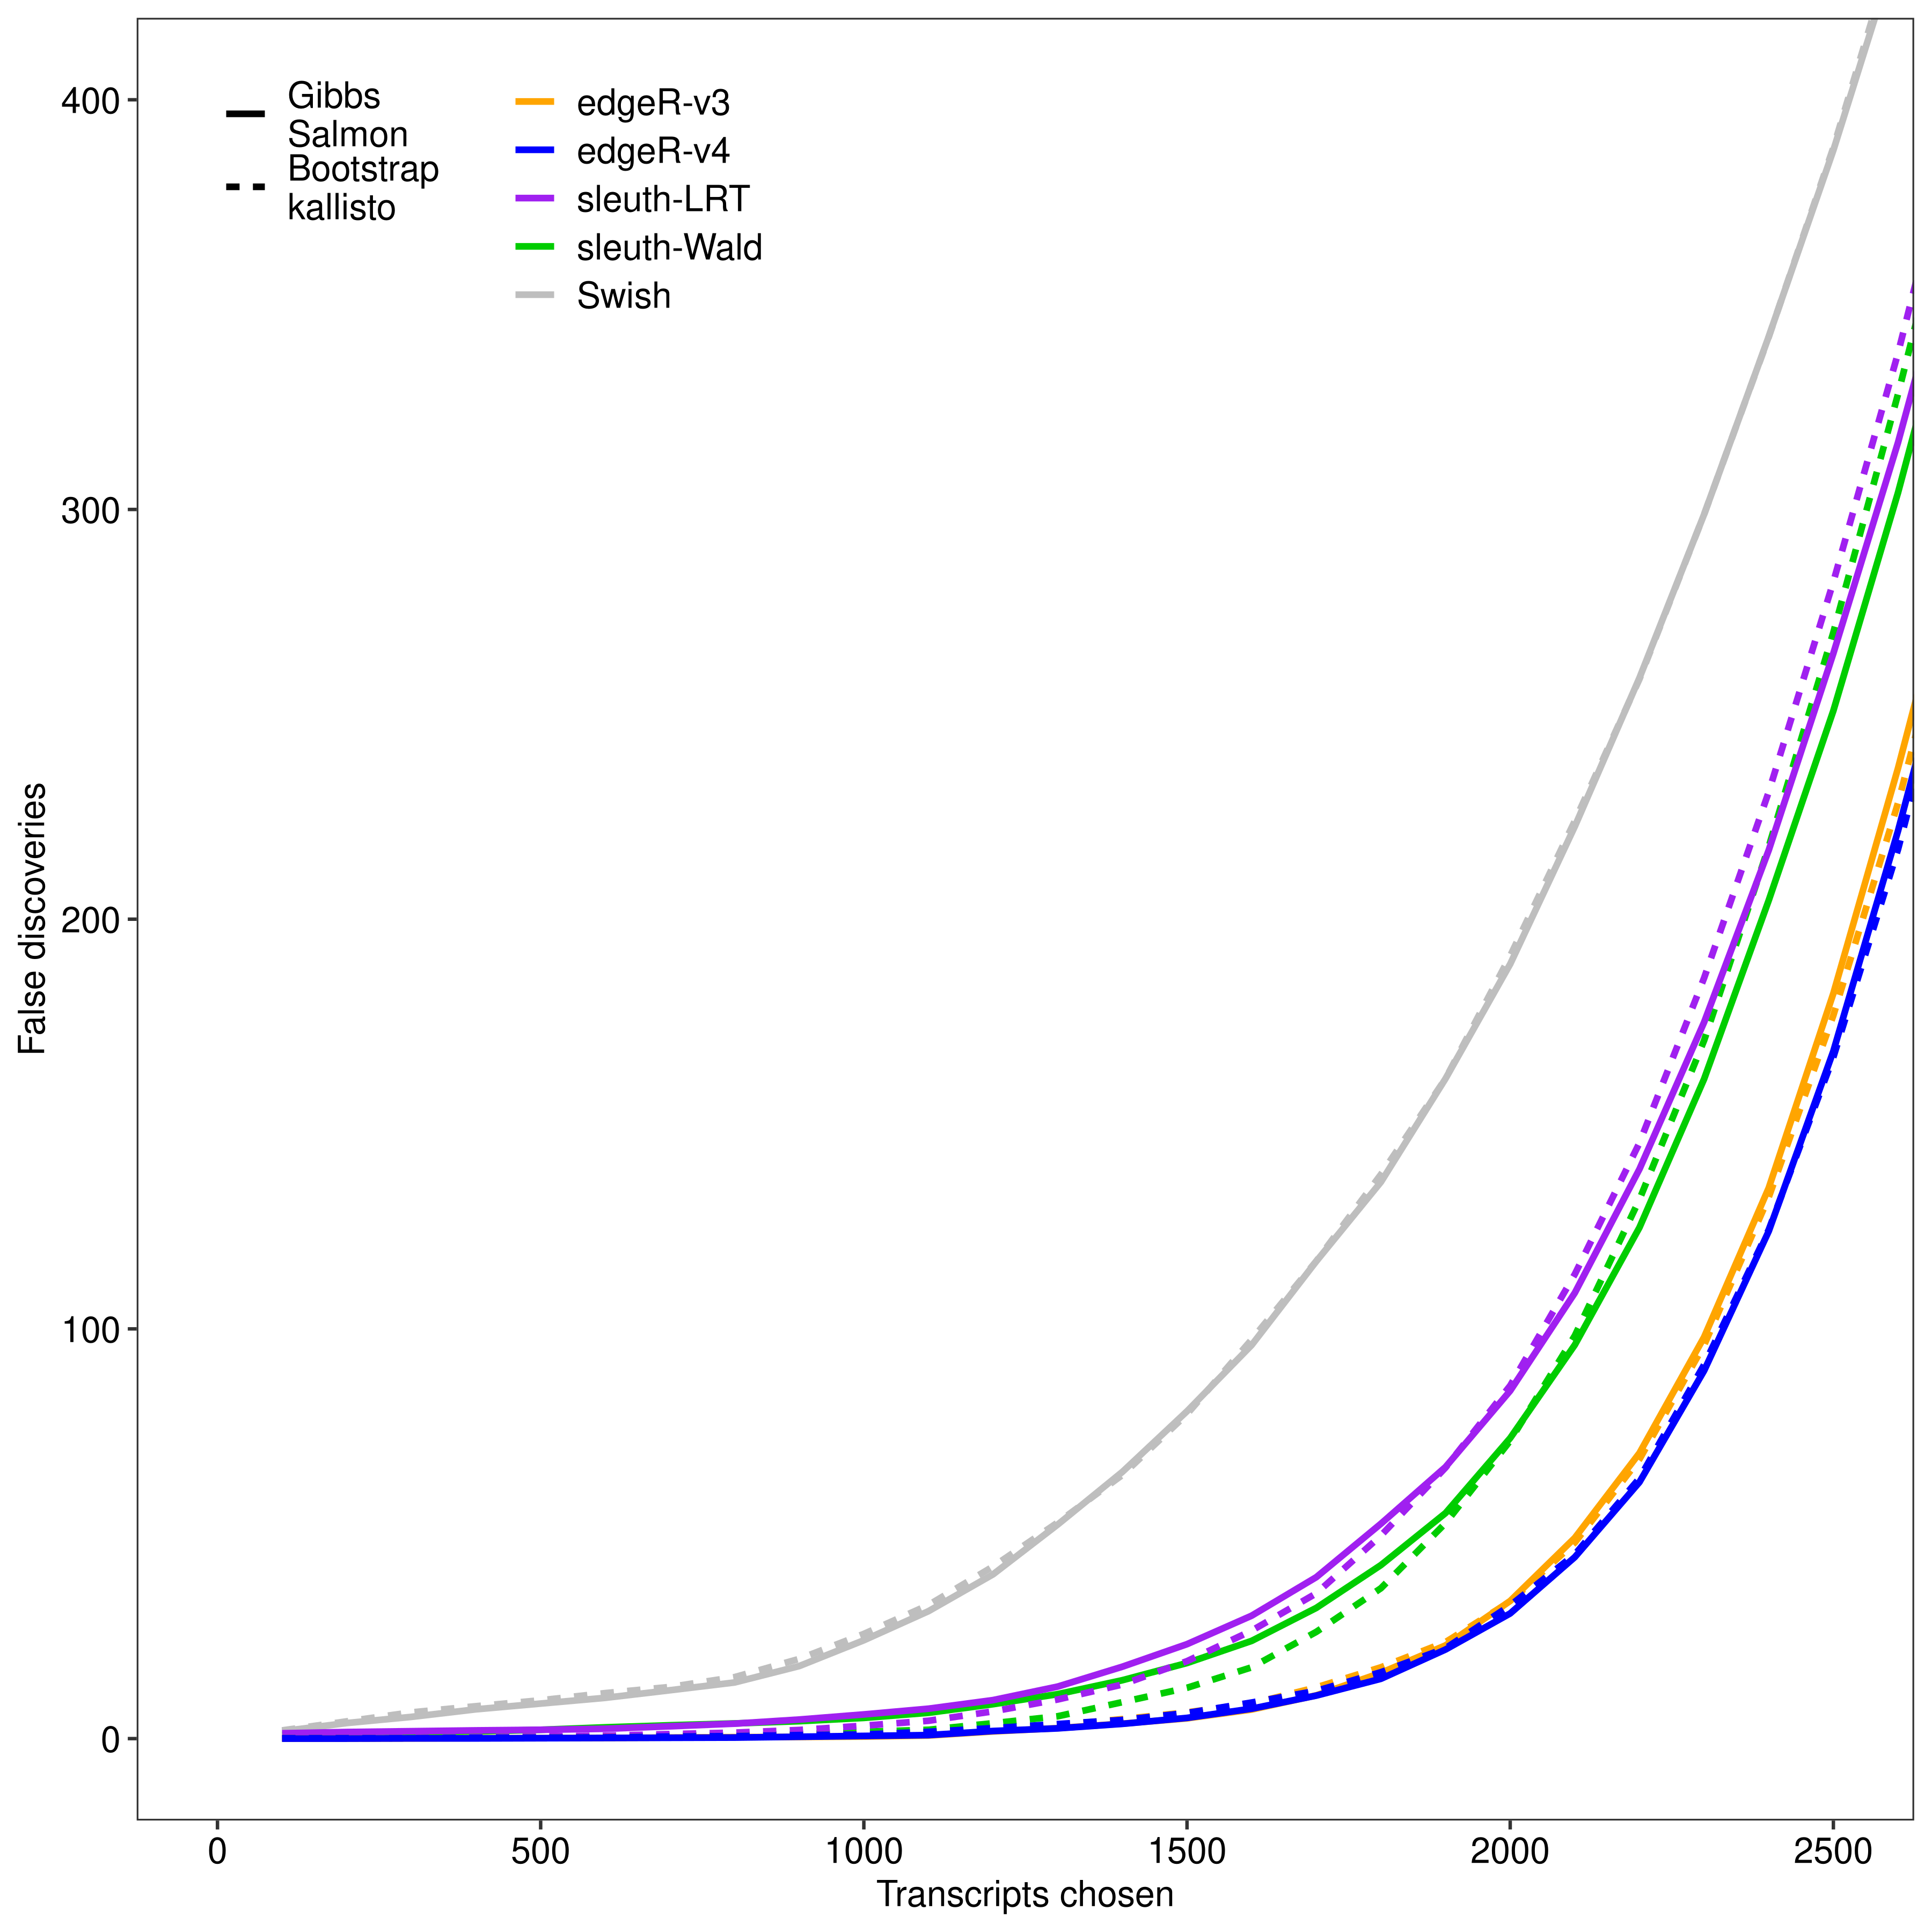
fig.fdr.kallisto.10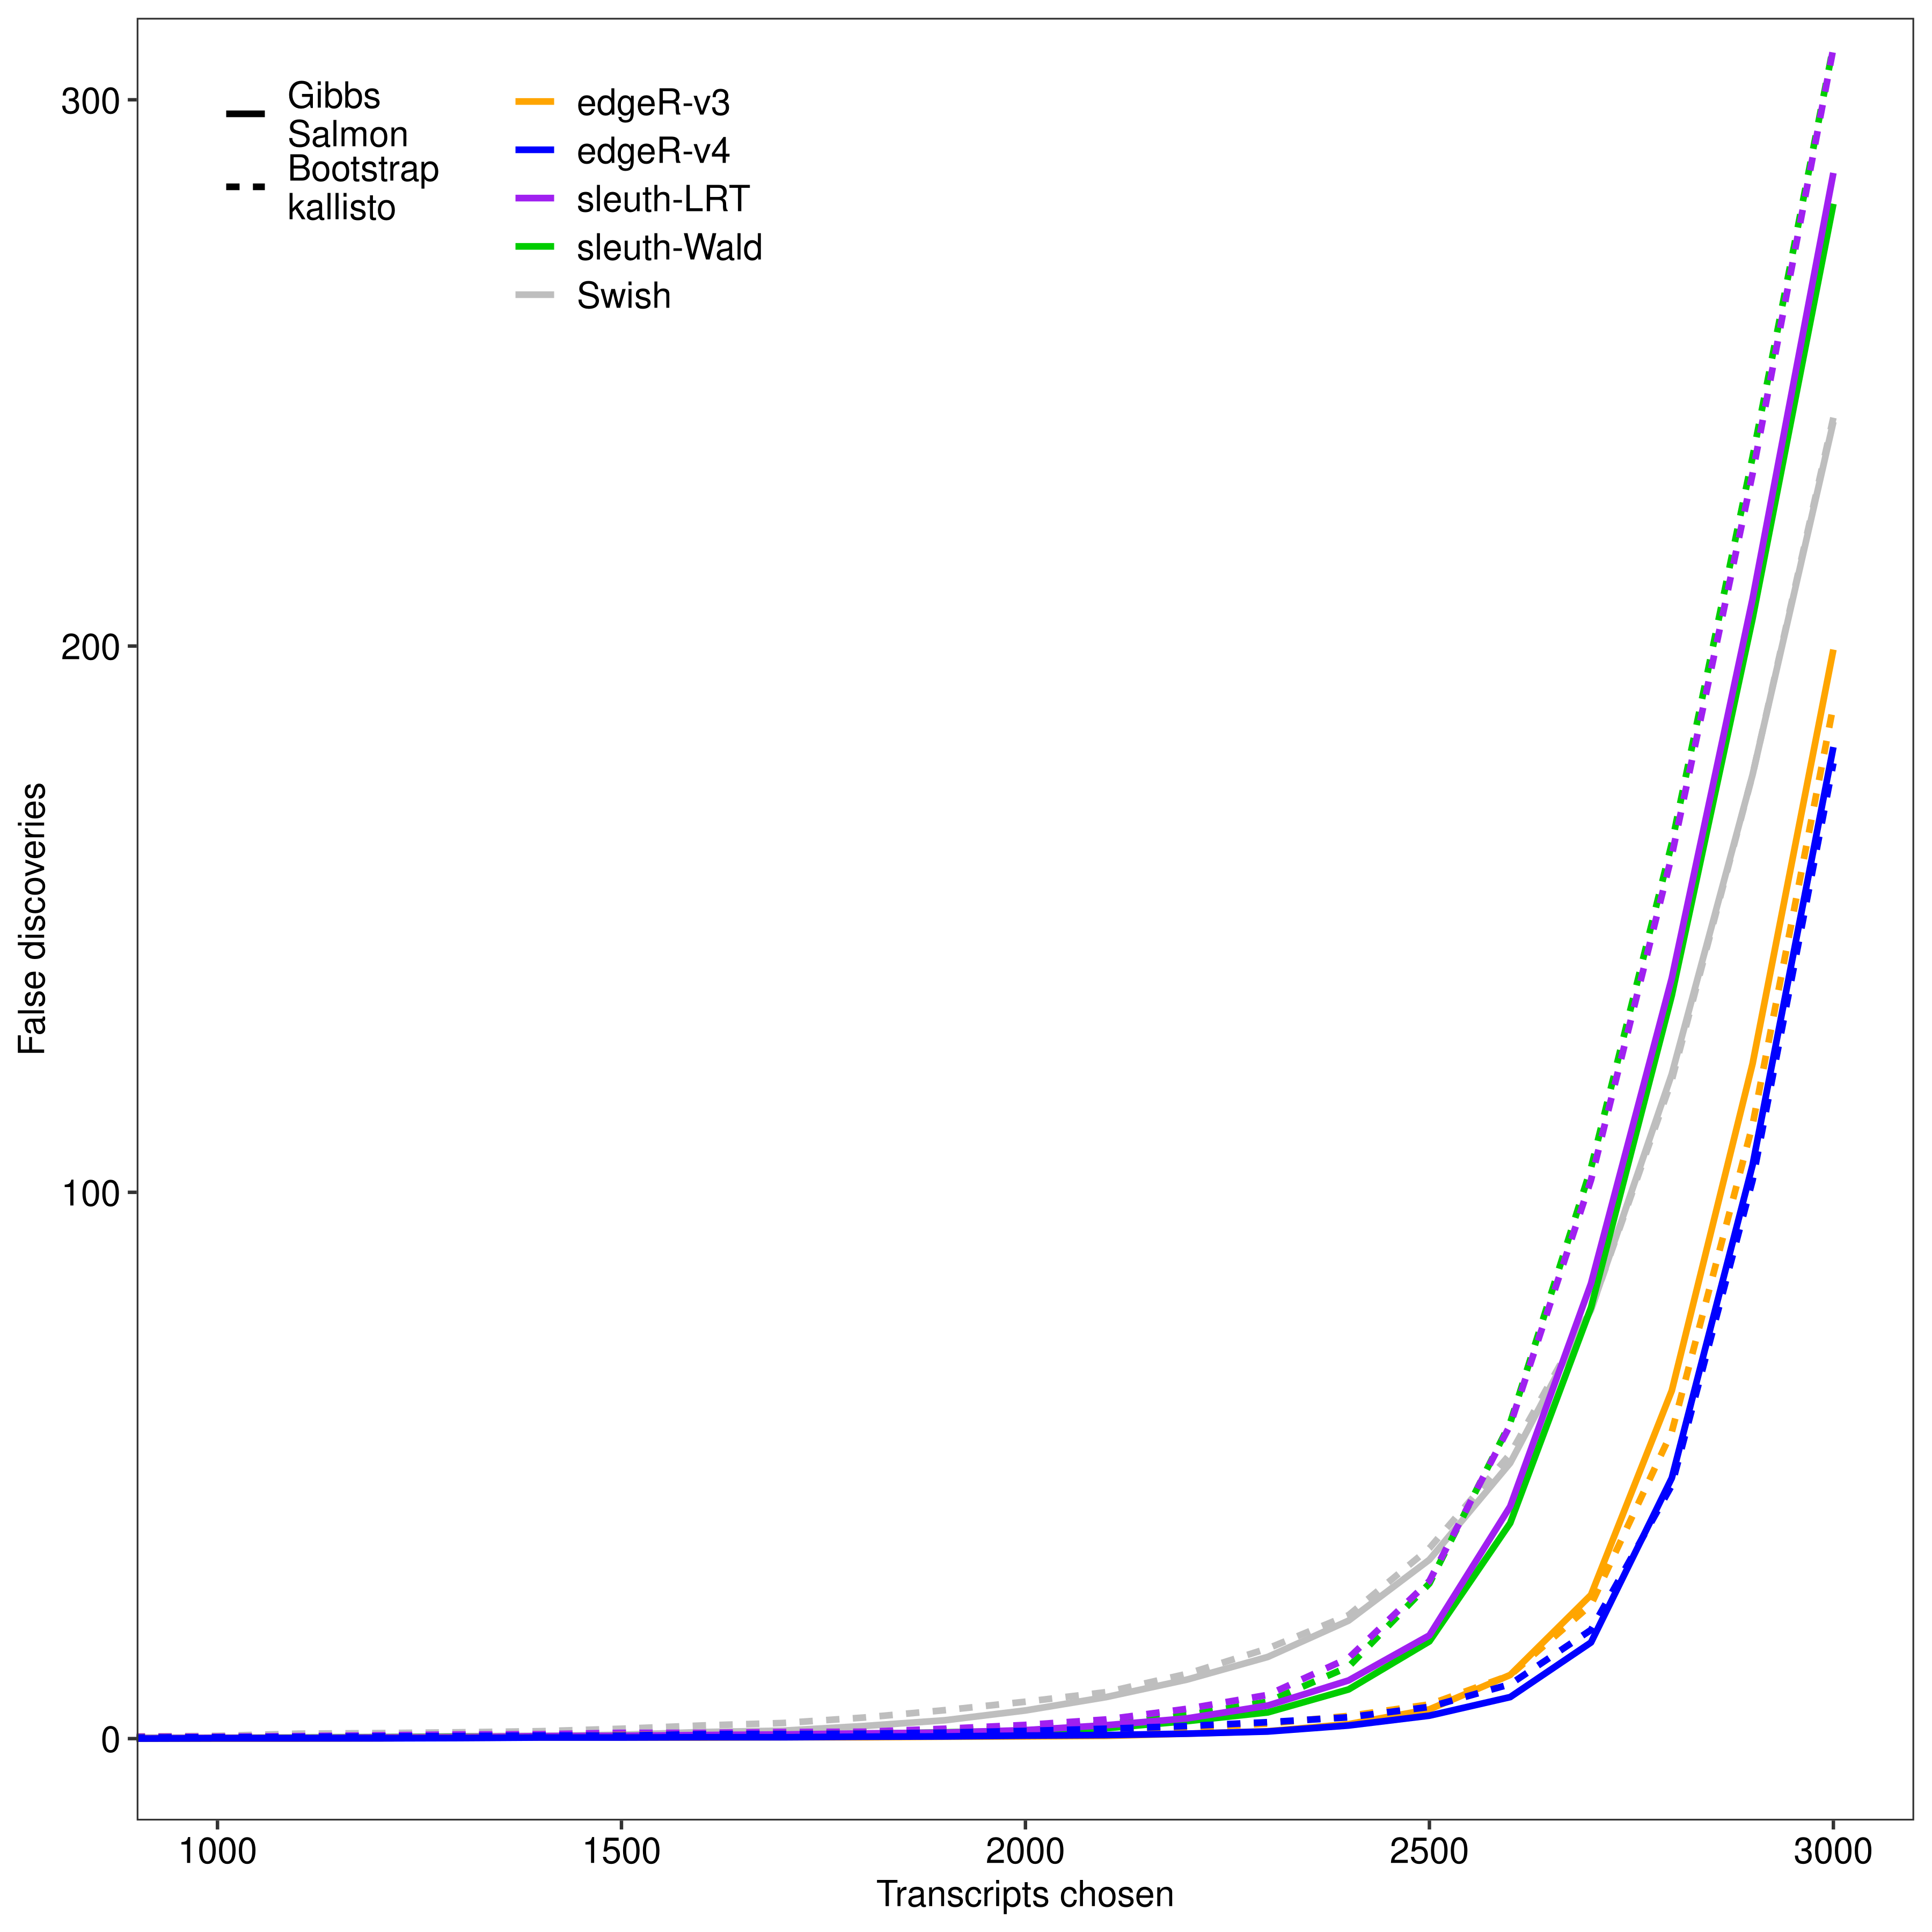
ROC curves
Below is the code chunk used to generate Supplementary Figure S9.
dt.rcurve <- dt.roc[FC == 'fc2' &
                      grepl("edgeR-SC|edgeR-SC\\.n",Method) &
                      Scenario == 'unbalanced',]

dt.rcurve$LibsPerGroup %<>% factor(levels = paste0('#Lib/Group = ', c(3, 5, 10)),labels = paste0(c('Three','Five', 'Ten'),' samples per group'))
dt.rcurve$Scenario %<>% factor(levels = c('balanced','unbalanced'),labels = c('Equal library sizes','Unequal library sizes'))
dt.rcurve$Quantifier %<>% factor(levels = c('kallisto','Salmon-Boot','Salmon-Gibbs'),labels = c('Bootstrap (kallisto)','Bootstrap (Salmon)','Gibbs (Salmon)'))
dt.rcurve$Method %<>%
  factor(levels = c(paste0('edgeR-SC.n',seq(10,90,10)),'edgeR-SC')) %<>%
  mapvalues(from = c(paste0('edgeR-SC.n',seq(10,90,10)),'edgeR-SC'),to = paste0(seq(10,100,10)))

dt.rcurve.long <- melt(dt.rcurve,
                       id.vars = c('Genome','Length','FC','Reads','TxPerGene','Scenario','LibsPerGroup','Quantifier','Method','nFDR'),
                       measure.vars = c('oTPR','oFDR'),
                       variable.name = 'Type',
                       value.name = 'Value')

foo <- function(x,lib,type,ylab,title = NULL,base_size = bs,legend = TRUE,...){
  sub.x <- x[LibsPerGroup == lib & Type == type,]

  sub.x$nFDR_char <- roundPretty(sub.x$nFDR,digits = 2)
  sub.x$nFDR_char %<>% factor(levels = c('0.01','0.05','0.10','0.15','0.20'))

  shape <- 21:25
  names(shape) <- c('0.01','0.05','0.10','0.15','0.20')

  p <- ggplot(data = sub.x, aes(x = Method,y = Value,group = interaction(nFDR_char,Quantifier))) +
    geom_line(aes(color = Quantifier),linewidth = 0.25) +
    geom_point(aes(shape = nFDR_char,color = Quantifier,fill = Quantifier),size = 1.25) +
    theme_bw(base_size = bs,base_family = 'sans') +
    scale_color_manual(values = c('Bootstrap (kallisto)' = 'green3','Bootstrap (Salmon)' = 'red','Gibbs (Salmon)' = 'blue')) +
    scale_fill_manual(values = c('Bootstrap (kallisto)' = 'green3','Bootstrap (Salmon)' = 'red','Gibbs (Salmon)' = 'blue'),guide = "none") +
    scale_shape_manual(values = shape) +
    coord_cartesian(...) +
    theme(panel.grid = element_blank(),
          plot.title = element_text(hjust = 0.5,size = base_size),
          axis.text = element_text(colour = 'black',size = base_size),
          strip.text = element_text(colour = 'black',size = base_size)) +
    labs(x = 'Number of Resamples',y = ylab,shape = 'Nominal FDR',color = 'Method',title = title) +
    if (legend == TRUE) {theme(legend.background = element_rect(fill = alpha('white', 0)),
                               legend.text = element_text(size = base_size),
                               legend.title = element_text(size = base_size),
                               legend.margin = margin(0, 0, 0, 0))} else theme(legend.position = 'none')
  p
}

fig.roc.three.tpr <- foo(dt.rcurve.long,lib = 'Three samples per group',type = 'oTPR',ylab = 'Observed Power',ylim = c(0.1,0.7)) + labs(x = NULL,title = "n = 3")
fig.roc.five.tpr <- foo(dt.rcurve.long,lib = 'Five samples per group',type = 'oTPR',ylab = 'Observed Power',ylim = c(0.55,0.9)) + labs(x = NULL,y = NULL,title = "n = 5")
fig.roc.ten.tpr <- foo(dt.rcurve.long,lib = 'Ten samples per group',type = 'oTPR',ylab = 'Observed Power',ylim = c(0.875,0.975)) + labs(x = NULL,y = NULL,title = "n = 10") + scale_y_continuous(breaks = c(0.88,0.92,0.96))

fig.roc.three.fdr <- foo(dt.rcurve.long,lib = 'Three samples per group',type = 'oFDR',ylab = 'Observed FDR',ylim = c(0,0.2))
fig.roc.five.fdr <- foo(dt.rcurve.long,lib = 'Five samples per group',type = 'oFDR',ylab = 'Observed FDR',ylim = c(0,0.2)) + labs(y = NULL)
fig.roc.ten.fdr <- foo(dt.rcurve.long,lib = 'Ten samples per group',type = 'oFDR',ylab = 'Observed FDR',ylim = c(0,0.2)) + labs(y = NULL)

wrap_plots(A = fig.roc.three.tpr,
           B = fig.roc.five.tpr,
           C = fig.roc.ten.tpr,
           D = fig.roc.three.fdr,
           E = fig.roc.five.fdr,
           `F` = fig.roc.ten.fdr,
           design = c(area(1,1),area(1,2),area(1,3),
                      area(2,1),area(2,2),area(2,3))) +
  plot_layout(guides = 'collect') & theme(
    legend.position = 'bottom',
    legend.direction = 'horizontal',
    legend.box = 'vertical')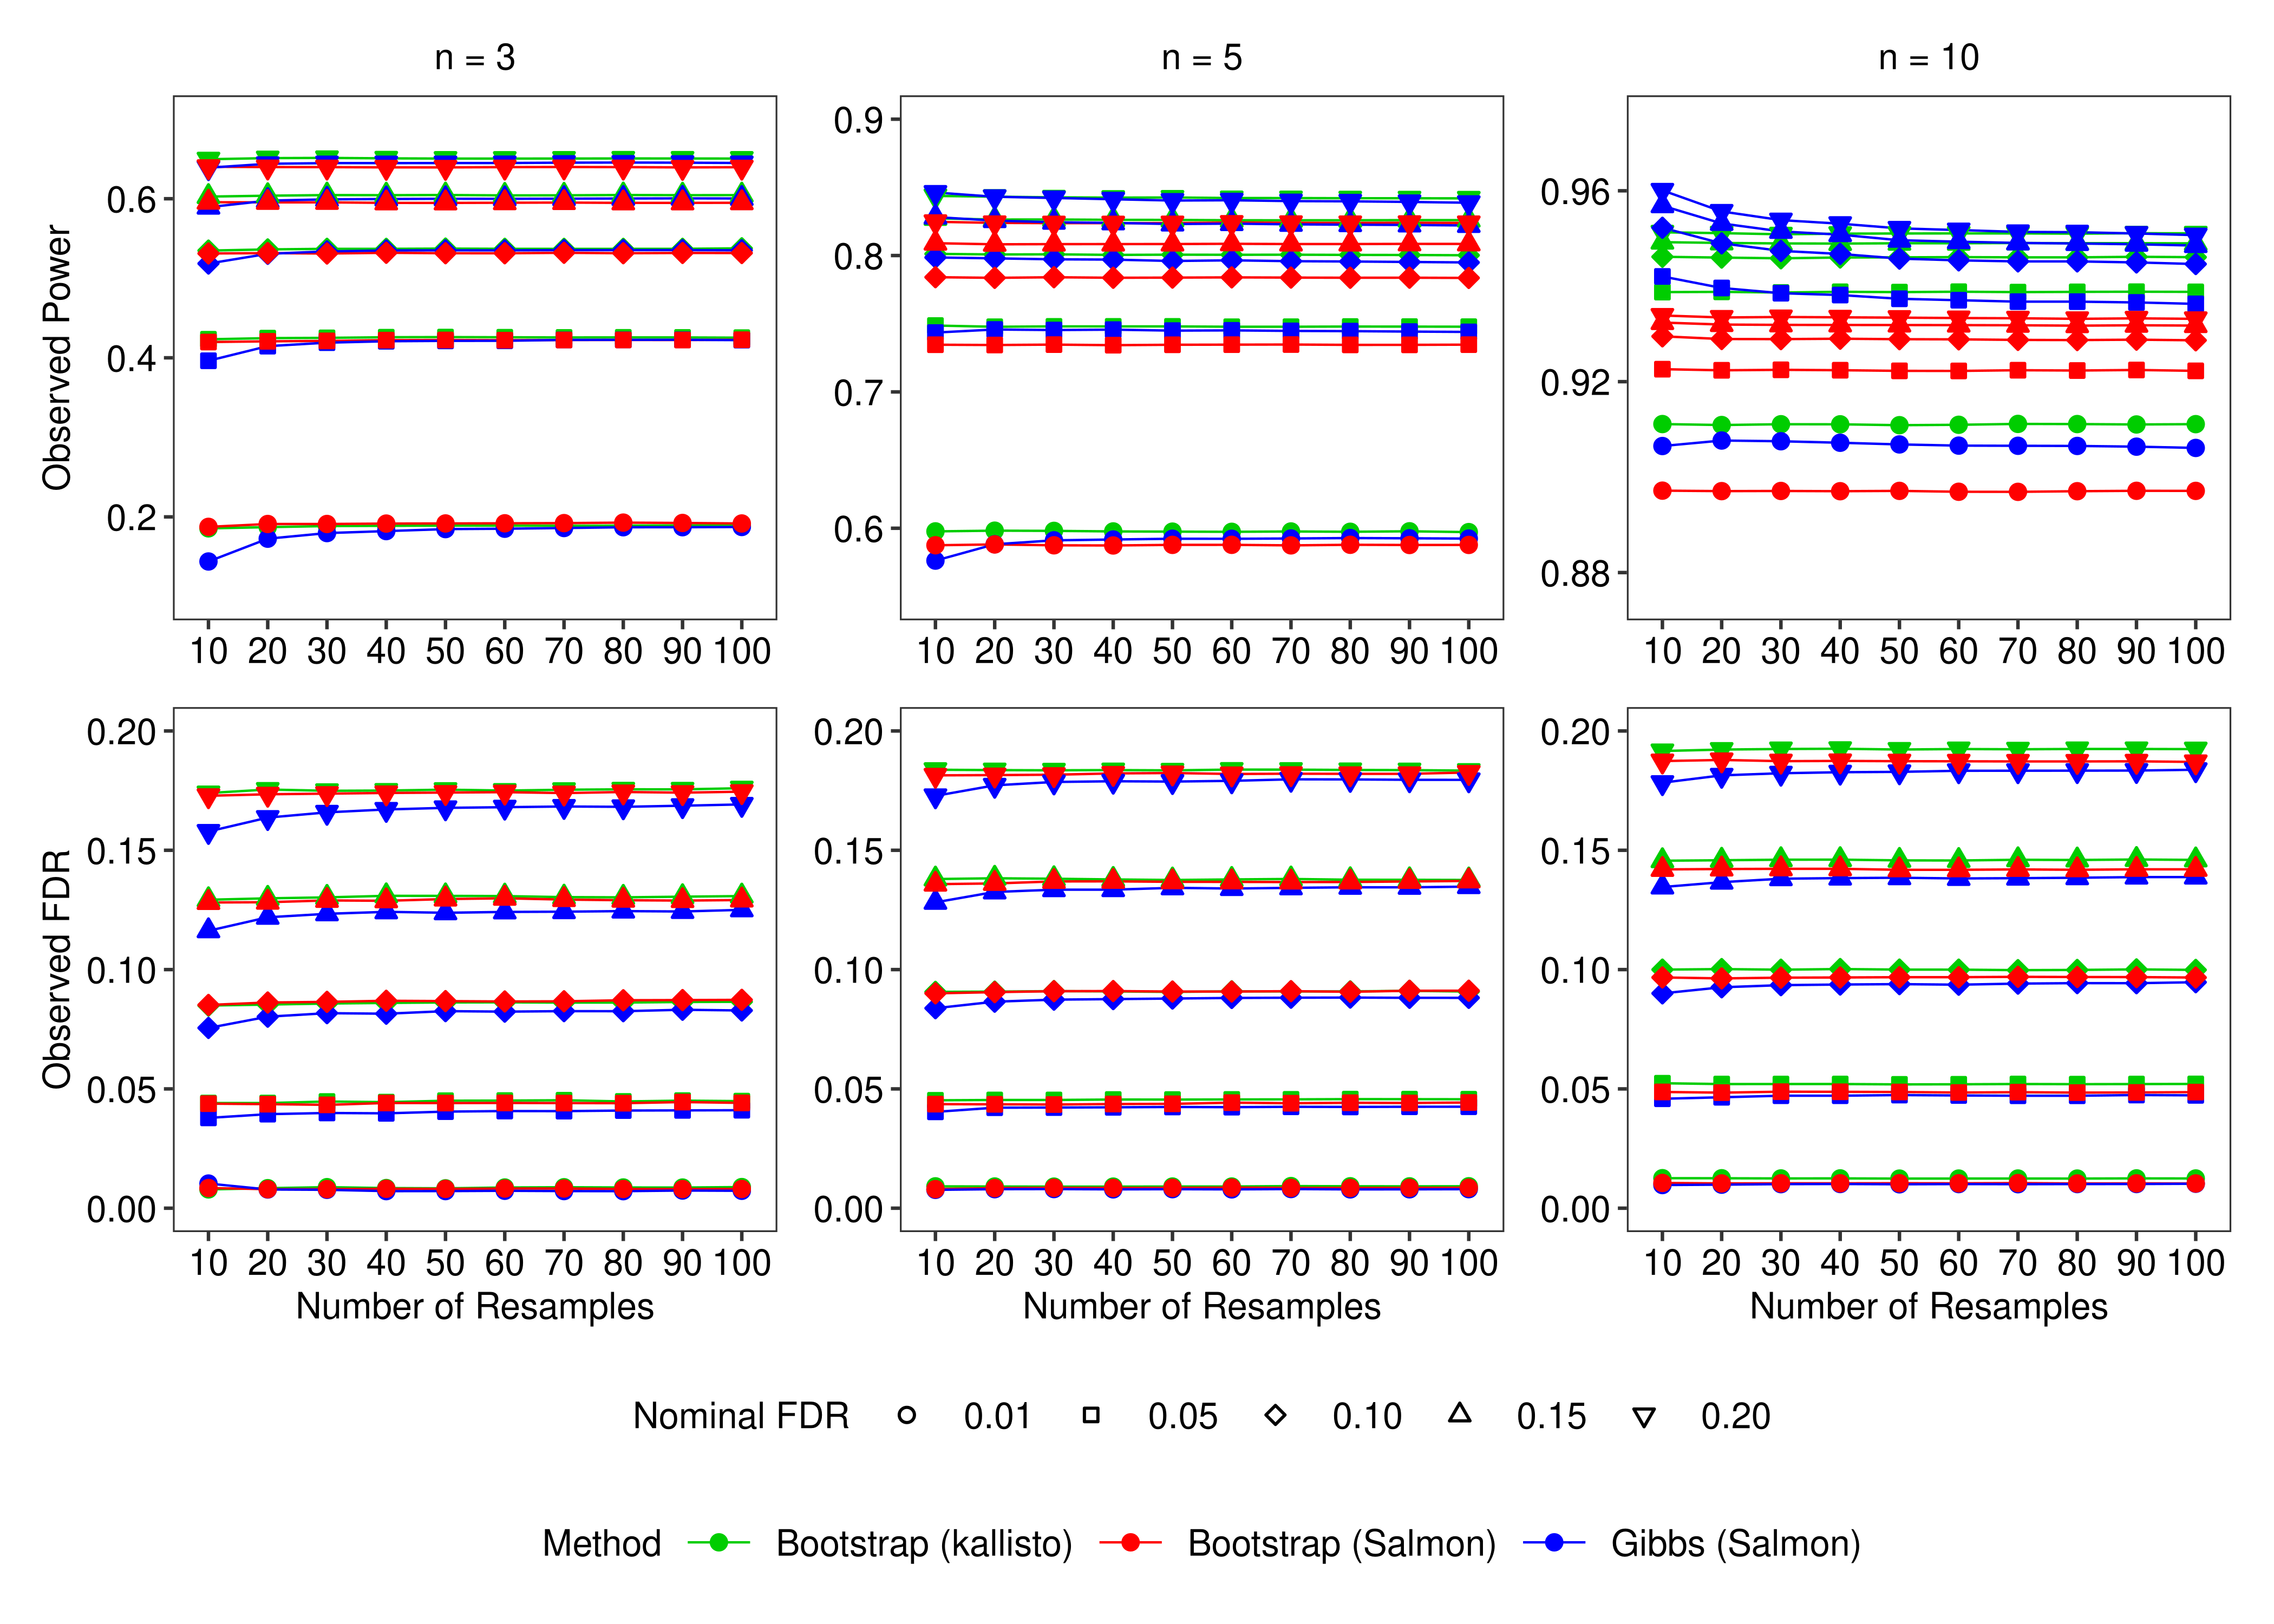
Quantification time
Below I generate Supplementary Table S1.
dt.salmontime <- dt.quanttime[,
                              .(TotalTime = mean(Time)/60,
                                ResamplingTime = mean(ResamplingTime)/60),
                              by = c('LibSize','Quantifier')]

dt.salmontime$QuantTime <- dt.salmontime$TotalTime - dt.salmontime$ResamplingTime
setcolorder(dt.salmontime,c('Quantifier','LibSize','QuantTime','ResamplingTime','TotalTime'))

dt.salmontime$LibSize %<>% factor(levels = c('2.5e+07','5e+07','1e+08'),
                                  labels = c('25','50','100'))

dt.salmontime$Quantifier %<>% factor(levels = c('kallisto','Salmon-Boot','Salmon-Gibbs'),
                                     labels = c('Bootstrap (kallisto)','Bootstrap (Salmon)','Gibbs (Salmon)'))

dt.salmontime <- dt.salmontime[order(Quantifier,LibSize),]

cnames <- c('Resampling\nMethod',
            'Library Size\n(million read pairs)',
            'Optimization',
            'Resampling',
            'Total')

tb.salmontime <- kbl(x = dt.salmontime,
                     format = 'latex',
                     digits = 2,
                     col.names = linebreak(cnames,align = 'c'),
                     align = 'ccccc',
                     escape = FALSE,
                     booktabs = TRUE) %>%
  add_header_above(c(" " = 2, "Quantification Time (minutes)" = 3)) %>%
  collapse_rows(1, latex_hline = 'major')

kbl(x = dt.salmontime,
    format = 'pipe',
    digits = 2,
    col.names = linebreak(cnames,align = 'c'),
    align = 'ccccc',
    escape = FALSE,
    booktabs = TRUE) %>%
  add_header_above(c(" " = 2, "Quantification Time (minutes)" = 3)) %>%
collapse_rows(1, latex_hline = 'major')| Optimization | Resampling | Total | ||
|---|---|---|---|---|
| Bootstrap (kallisto) | 25 |
|
|
4.92 |
| 50 |
|
|
7.32 | |
| 100 |
|
|
11.71 | |
| Bootstrap (Salmon) | 25 | 1.79 | 9.45 | 11.24 |
| 50 | 3.22 | 13.41 | 16.64 | |
| 100 | 6.09 | 19.15 | 25.24 | |
| Gibbs (Salmon) | 25 | 1.78 | 0.91 | 2.69 |
| 50 | 3.22 | 1.62 | 4.85 | |
| 100 | 6.05 | 3.01 | 9.06 |
Output files
And finally all files are exported to be incorporated in the supplement.
fig.metrics.salmon.3 <- wrap_plots(A = fig.power.salmon.3,
                                   B = fig.fdr.salmon.3,
                                   design = c(area(1,1),area(2,1)),
                                   heights = c(0.25,0.75)) +
  plot_annotation(tag_levels = 'a',
                  theme = theme(plot.tag = element_text(size = bs)))

fig.metrics.salmon.10 <- wrap_plots(A = fig.power.salmon.10,
                                    B = fig.fdr.salmon.10,
                                    design = c(area(1,1),area(2,1)),
                                    heights = c(0.25,0.75)) +
  plot_annotation(tag_levels = 'a',
                  theme = theme(plot.tag = element_text(size = bs)))

fig.metrics.kallisto.3 <- wrap_plots(A = fig.power.kallisto.3,
                                     B = fig.fdr.kallisto.3,
                                     design = c(area(1,1),area(2,1)),
                                     heights = c(0.25,0.75)) +
  plot_annotation(tag_levels = 'a',
                  theme = theme(plot.tag = element_text(size = bs)))

fig.metrics.kallisto.5 <- wrap_plots(A = fig.power.kallisto.5,
                                     B = fig.fdr.kallisto.5,
                                     design = c(area(1,1),area(2,1)),
                                     heights = c(0.25,0.75)) +
  plot_annotation(tag_levels = 'a',
                  theme = theme(plot.tag = element_text(size = bs)))

fig.metrics.kallisto.10 <- wrap_plots(A = fig.power.kallisto.10,
                                      B = fig.fdr.kallisto.10,
                                      design = c(area(1,1),area(2,1)),
                                      heights = c(0.25,0.75)) +
  plot_annotation(tag_levels = 'a',
                  theme = theme(plot.tag = element_text(size = bs)))

ggsave(plot = fig.metrics.salmon.3,filename = file.path(path.misc,'SuppFigure-Metrics-Salmon-3.pdf'),
       device = 'pdf',width = 6,height = 8,units = 'in',dpi = 300)
ggsave(plot = fig.metrics.salmon.10,filename = file.path(path.misc,'SuppFigure-Metrics-Salmon-10.pdf'),
       device = 'pdf',width = 6,height = 8,units = 'in',dpi = 300)

ggsave(plot = fig.metrics.kallisto.3,filename = file.path(path.misc,'SuppFigure-Metrics-kallisto-3.pdf'),
       device = 'pdf',width = 6,height = 8,units = 'in',dpi = 300)
ggsave(plot = fig.metrics.kallisto.5,filename = file.path(path.misc,'SuppFigure-Metrics-kallisto-5.pdf'),
       device = 'pdf',width = 6,height = 8,units = 'in',dpi = 300)
ggsave(plot = fig.metrics.kallisto.10,filename = file.path(path.misc,'SuppFigure-Metrics-kallisto-10.pdf'),
       device = 'pdf',width = 6,height = 8,units = 'in',dpi = 300)

fig.roc <- wrap_plots(A = fig.roc.three.tpr,
           B = fig.roc.five.tpr,
           C = fig.roc.ten.tpr,
           D = fig.roc.three.fdr,
           E = fig.roc.five.fdr,
           `F` = fig.roc.ten.fdr,
           design = c(area(1,1),area(1,2),area(1,3),
                      area(2,1),area(2,2),area(2,3))) +
  plot_layout(guides = 'collect') & theme(
    legend.position = 'bottom',
    legend.direction = 'horizontal',
    legend.box = 'vertical')

ggsave(plot = fig.roc,filename = file.path(path.misc,'SuppFigure-ROC.pdf'),
       device = 'pdf',width = 7,height = 5,units = 'in',dpi = 300)

save_kable(tb.salmontime,file = file.path(path.misc,'SuppTable-QuantTime.tex'))
sessionInfo()R version 4.3.3 (2024-02-29)
Platform: x86_64-pc-linux-gnu (64-bit)
Running under: Red Hat Enterprise Linux 9.4 (Plow)
Matrix products: default
BLAS: /stornext/System/data/software/rhel/9/base/tools/R/4.3.3/lib64/R/lib/libRblas.so
LAPACK: /stornext/System/data/software/rhel/9/base/tools/R/4.3.3/lib64/R/lib/libRlapack.so; LAPACK version 3.11.0
locale:
[1] LC_CTYPE=en_US.UTF-8 LC_NUMERIC=C
[3] LC_TIME=en_US.UTF-8 LC_COLLATE=en_US.UTF-8
[5] LC_MONETARY=en_US.UTF-8 LC_MESSAGES=en_US.UTF-8
[7] LC_PAPER=en_US.UTF-8 LC_NAME=C
[9] LC_ADDRESS=C LC_TELEPHONE=C
[11] LC_MEASUREMENT=en_US.UTF-8 LC_IDENTIFICATION=C
time zone: Australia/Melbourne
tzcode source: system (glibc)
attached base packages:
[1] stats graphics grDevices datasets utils methods base
other attached packages:
[1] pkg_1.0 kableExtra_1.4.0 plyr_1.8.9 patchwork_1.3.0
[5] ggplot2_3.5.1 magrittr_2.0.3 data.table_1.16.0 workflowr_1.7.1
loaded via a namespace (and not attached):
[1] splines_4.3.3 later_1.3.2
[3] BiocIO_1.12.0 bitops_1.0-8
[5] filelock_1.0.3 R.oo_1.26.0
[7] tibble_3.2.1 XML_3.99-0.17
[9] lifecycle_1.0.4 edgeR_4.0.16
[11] rprojroot_2.0.4 processx_3.8.4
[13] lattice_0.22-5 ensembldb_2.26.0
[15] limma_3.58.1 sass_0.4.9
[17] rmarkdown_2.28 jquerylib_0.1.4
[19] yaml_2.3.10 remotes_2.5.0
[21] httpuv_1.6.15 sessioninfo_1.2.2
[23] pkgbuild_1.4.4 DBI_1.2.3
[25] abind_1.4-8 pkgload_1.4.0
[27] zlibbioc_1.48.2 GenomicRanges_1.54.1
[29] R.utils_2.12.3 purrr_1.0.2
[31] AnnotationFilter_1.26.0 BiocGenerics_0.48.1
[33] RCurl_1.98-1.16 rappdirs_0.3.3
[35] git2r_0.33.0 GenomeInfoDbData_1.2.11
[37] wasabi_1.0.1 IRanges_2.36.0
[39] S4Vectors_0.40.2 fishpond_2.8.0
[41] svglite_2.1.3 codetools_0.2-19
[43] DelayedArray_0.28.0 xml2_1.3.6
[45] tidyselect_1.2.1 farver_2.1.2
[47] matrixStats_1.4.1 stats4_4.3.3
[49] BiocFileCache_2.10.2 GenomicAlignments_1.38.2
[51] jsonlite_1.8.9 ellipsis_0.3.2
[53] systemfonts_1.1.0 tools_4.3.3
[55] progress_1.2.3 ragg_1.3.3
[57] Rcpp_1.0.13 glue_1.8.0
[59] svMisc_1.2.3 SparseArray_1.2.4
[61] xfun_0.47 MatrixGenerics_1.14.0
[63] usethis_3.0.0 GenomeInfoDb_1.38.8
[65] dplyr_1.1.4 withr_3.0.1
[67] BiocManager_1.30.25 fastmap_1.2.0
[69] rhdf5filters_1.14.1 fansi_1.0.6
[71] callr_3.7.6 digest_0.6.37
[73] R6_2.5.1 mime_0.12
[75] textshaping_0.4.0 colorspace_2.1-1
[77] gtools_3.9.5 biomaRt_2.58.2
[79] RSQLite_2.3.7 R.methodsS3_1.8.2
[81] utf8_1.2.4 generics_0.1.3
[83] renv_1.0.9 tximeta_1.20.3
[85] rtracklayer_1.62.0 prettyunits_1.2.0
[87] httr_1.4.7 htmlwidgets_1.6.4
[89] S4Arrays_1.2.1 whisker_0.4.1
[91] pkgconfig_2.0.3 gtable_0.3.5
[93] blob_1.2.4 SingleCellExperiment_1.24.0
[95] XVector_0.42.0 htmltools_0.5.8.1
[97] profvis_0.4.0 ProtGenerics_1.34.0
[99] sleuth_0.30.1 scales_1.3.0
[101] Biobase_2.62.0 Rsubread_2.16.1
[103] png_0.1-8 knitr_1.48
[105] rstudioapi_0.16.0 tzdb_0.4.0
[107] rjson_0.2.23 curl_5.2.3
[109] cachem_1.1.0 rhdf5_2.46.1
[111] stringr_1.5.1 BiocVersion_3.18.1
[113] parallel_4.3.3 miniUI_0.1.1.1
[115] AnnotationDbi_1.64.1 restfulr_0.0.15
[117] desc_1.4.3 pillar_1.9.0
[119] grid_4.3.3 vctrs_0.6.5
[121] urlchecker_1.0.1 promises_1.3.0
[123] dbplyr_2.5.0 xtable_1.8-4
[125] tximport_1.30.0 evaluate_1.0.0
[127] readr_2.1.5 GenomicFeatures_1.54.4
[129] locfit_1.5-9.10 cli_3.6.3
[131] compiler_4.3.3 Rsamtools_2.18.0
[133] rlang_1.1.4 crayon_1.5.3
[135] labeling_0.4.3 ps_1.8.0
[137] getPass_0.2-4 fs_1.6.4
[139] stringi_1.8.4 viridisLite_0.4.2
[141] BiocParallel_1.36.0 munsell_0.5.1
[143] Biostrings_2.70.3 lazyeval_0.2.2
[145] devtools_2.4.5 Matrix_1.6-5
[147] hms_1.1.3 bit64_4.5.2
[149] Rhdf5lib_1.24.2 KEGGREST_1.42.0
[151] statmod_1.5.0 shiny_1.9.1
[153] highr_0.11 SummarizedExperiment_1.32.0
[155] interactiveDisplayBase_1.40.0 AnnotationHub_3.10.1
[157] memoise_2.0.1 thematic_0.1.6
[159] bslib_0.8.0 bit_4.5.0